
Weighbridge Pouch-Matching
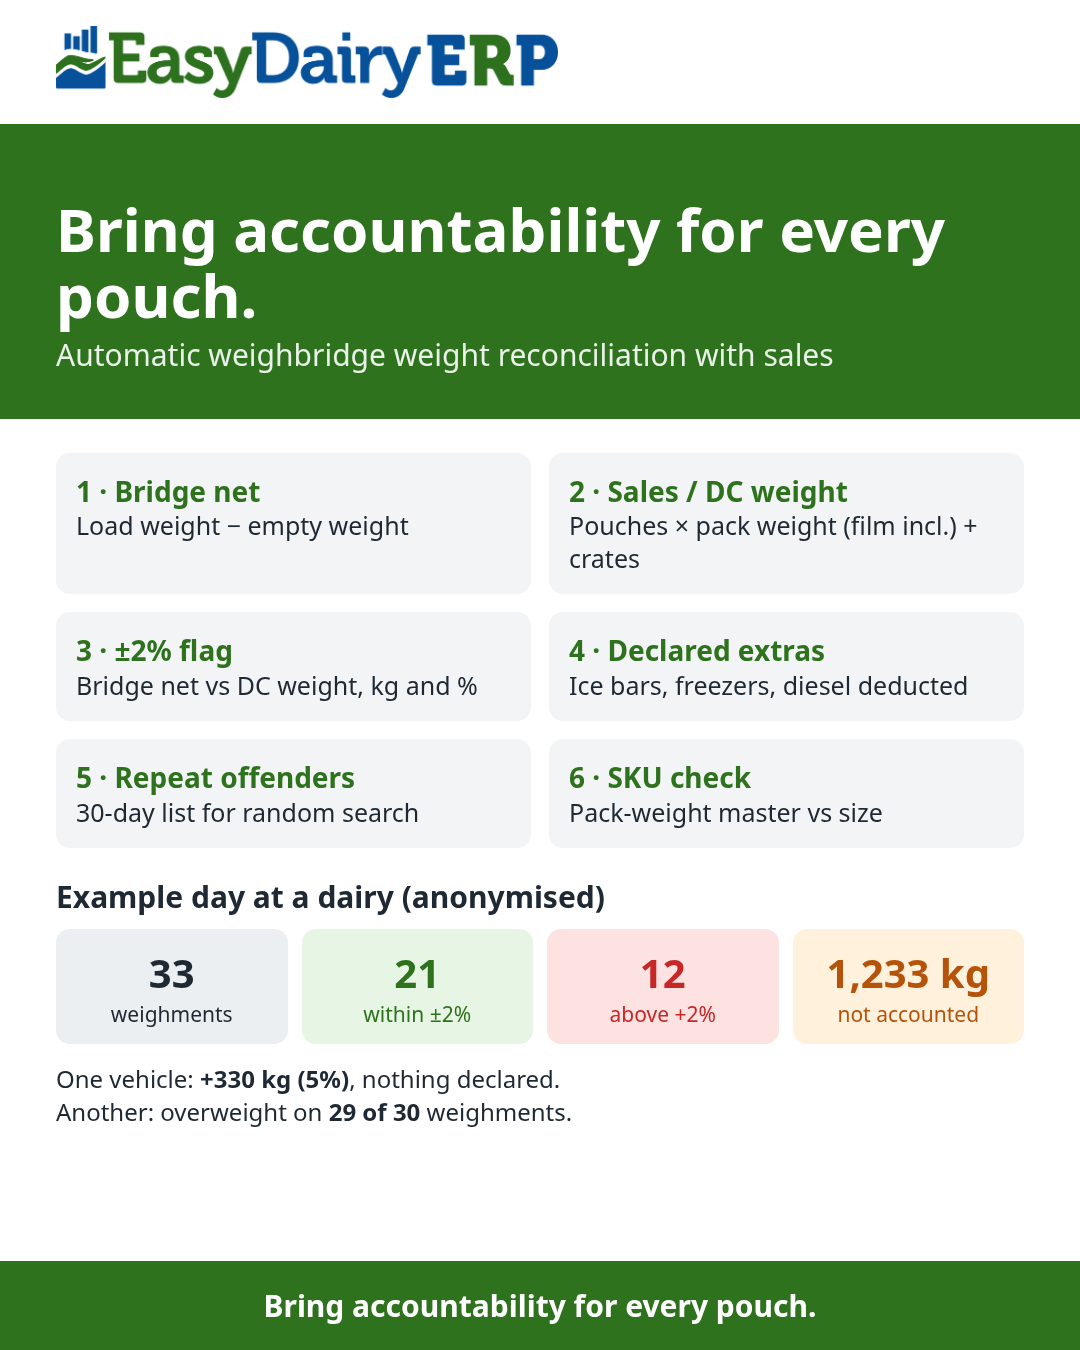
Bring accountability for every pouch. EasyDairyERP checks every loaded vehicle’s weighbridge weight against its sales and DC entries, so extra crates that leave without a DC are noticed.
What is weighbridge pouch-matching?
Weighbridge pouch-matching in EasyDairyERP takes each dispatch vehicle’s weighbridge net weight (loaded minus empty) and automatically compares it with the weight expected from the vehicle’s sales and DC (delivery challan) entries: pouches × pack weight from the pack-weight master, plus crates. Any trip more than ±2% away is flagged, after deducting ice bars or freezers declared by the office, and a 30-day report lists vehicles that are overweight again and again.
The screenshots and figures on this page are from one real dispatch day at a dairy using EasyDairyERP. Company, plant, route, product-brand and person names and real vehicle numbers have been removed or replaced.
Bring accountability for every pouch
Every pouch that leaves the plant should match a sales or DC entry, because the DC is what gets billed. Every evening, vehicles leave the dairy loaded with milk, curd and paneer pouches in crates. If extra crates go on a vehicle without a DC entry, they leave the gate unbilled, and nobody finds out until stock doesn’t tally.
One overweight trip can be an accident. The same vehicle overweight night after night is a pattern. The repeat-offender report lists those vehicles as candidates for a random search.
When a trip is flagged, the dispatch team stops or checks the vehicle before it leaves, counts the crates against the DC and, if the stock is genuine, corrects the DC and bills it. For repeat-offender vehicles, they pick them for a surprise crate count, ask why the excess isn’t declared, and set a standard ice-bar entry if that is the real reason.
Automatic weighbridge weight reconciliation with sales
Your weighbridge already weighs every vehicle. EasyDairyERP takes that weight and automatically checks it against the vehicle’s sales and DC entries, so every extra kilo gets noticed.
- Bridge net: the vehicle is weighed empty and then loaded. Loaded weight − empty weight = the material on board.
- Expected weight: every DC entered for the vehicle in the 2 hours before weighing. For each product, the number of pouches × that product’s pack weight from the pack-weight master (the real weight with film), plus the crates: 1.5 kg per pouch crate and 2.0 kg per cup crate.
- ±2% tolerance: bridge net is compared with the expected weight, in kg and %. Anything beyond ±2% is flagged in red.
- Declared extras: ice bars or a freezer recorded by the office against the weighment, with a remark, are deducted before the trip is judged.
- Flag and report: a day summary, the weighment list, a 30-day repeat-offender list and a pack-weight master check.
Weighbridge Pouch-Matching in under a minute
Bridge net, sales/DC weight, the ±2% flag, declared ice bars and freezers, and the repeat-offender report (English, 54 seconds)
How the check works, on one real trip
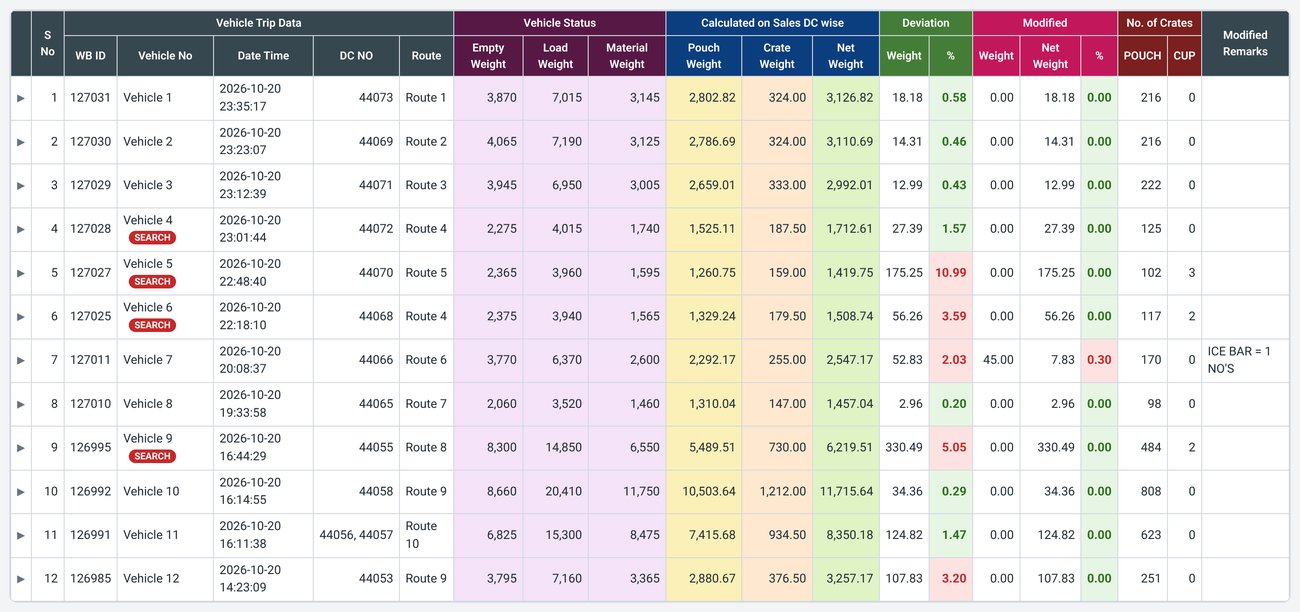
Here is an actual trip from one dairy’s dispatch report on 20 October (names and vehicle numbers removed). It’s shown as “Vehicle 9”.
Step 1: the weighbridge. The vehicle is weighed empty and then loaded. Loaded 14,850 kg − empty 8,300 kg = 6,550 kg of material on board.

Step 2: what the DC says. The system collects every DC entered for this vehicle in the 2 hours before weighing. For each product it multiplies the number of pouches by that product’s pack weight from the pack-weight master (the real weight with film; a 1-litre pouch weighs 1,034.49 g).
- 19,715 pouches across 28 products = 5,489.51 kg
- 484 pouch crates × 1.5 kg + 2 cup crates × 2.0 kg = 730 kg
- Expected load = 5,489.51 + 730 = 6,219.51 kg
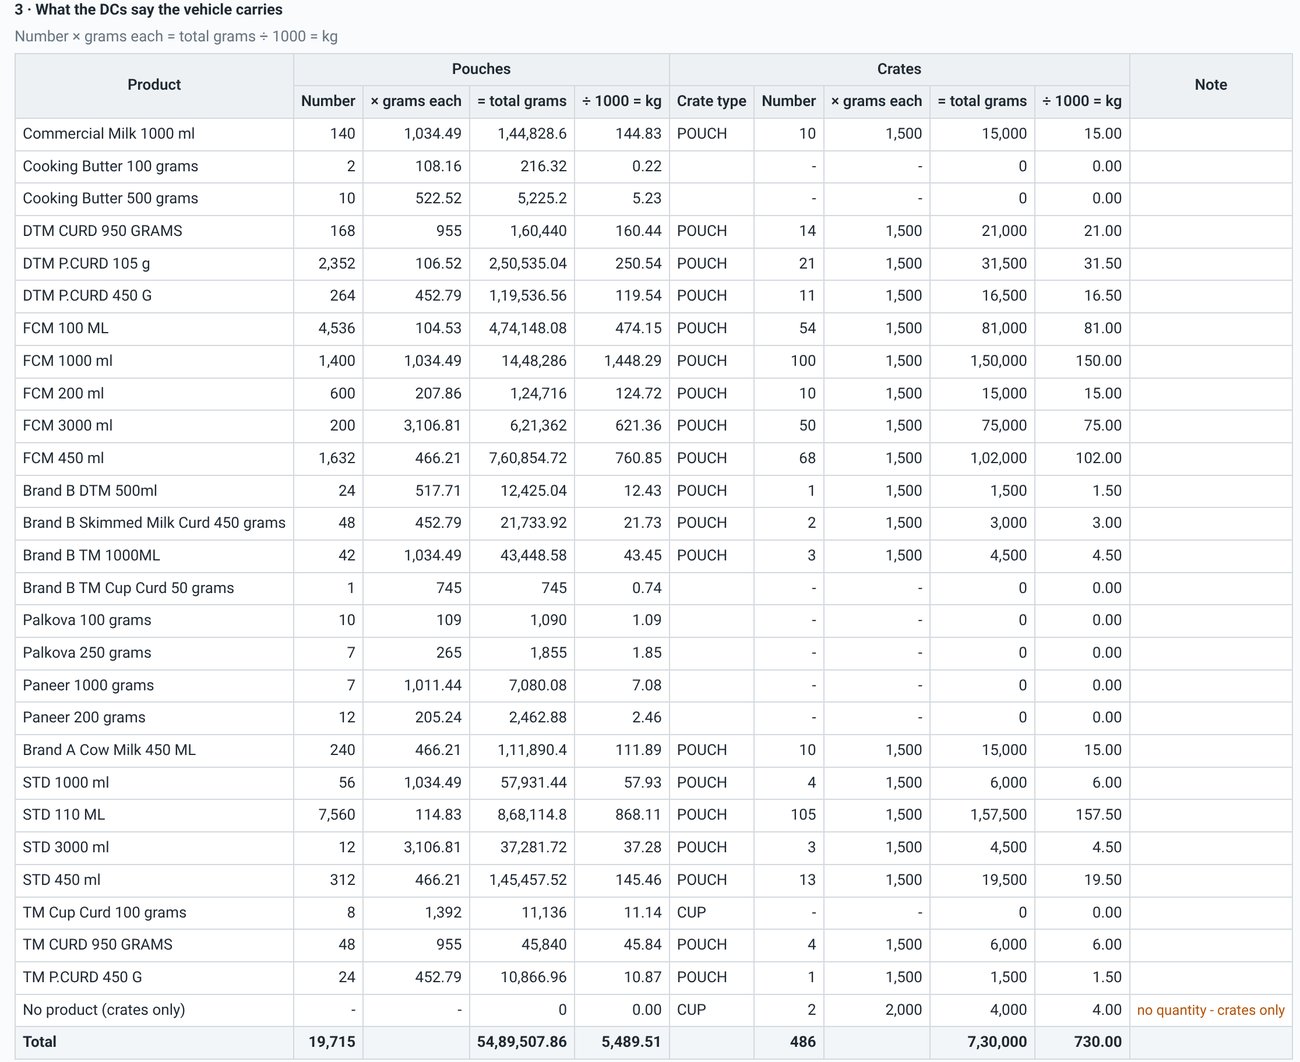
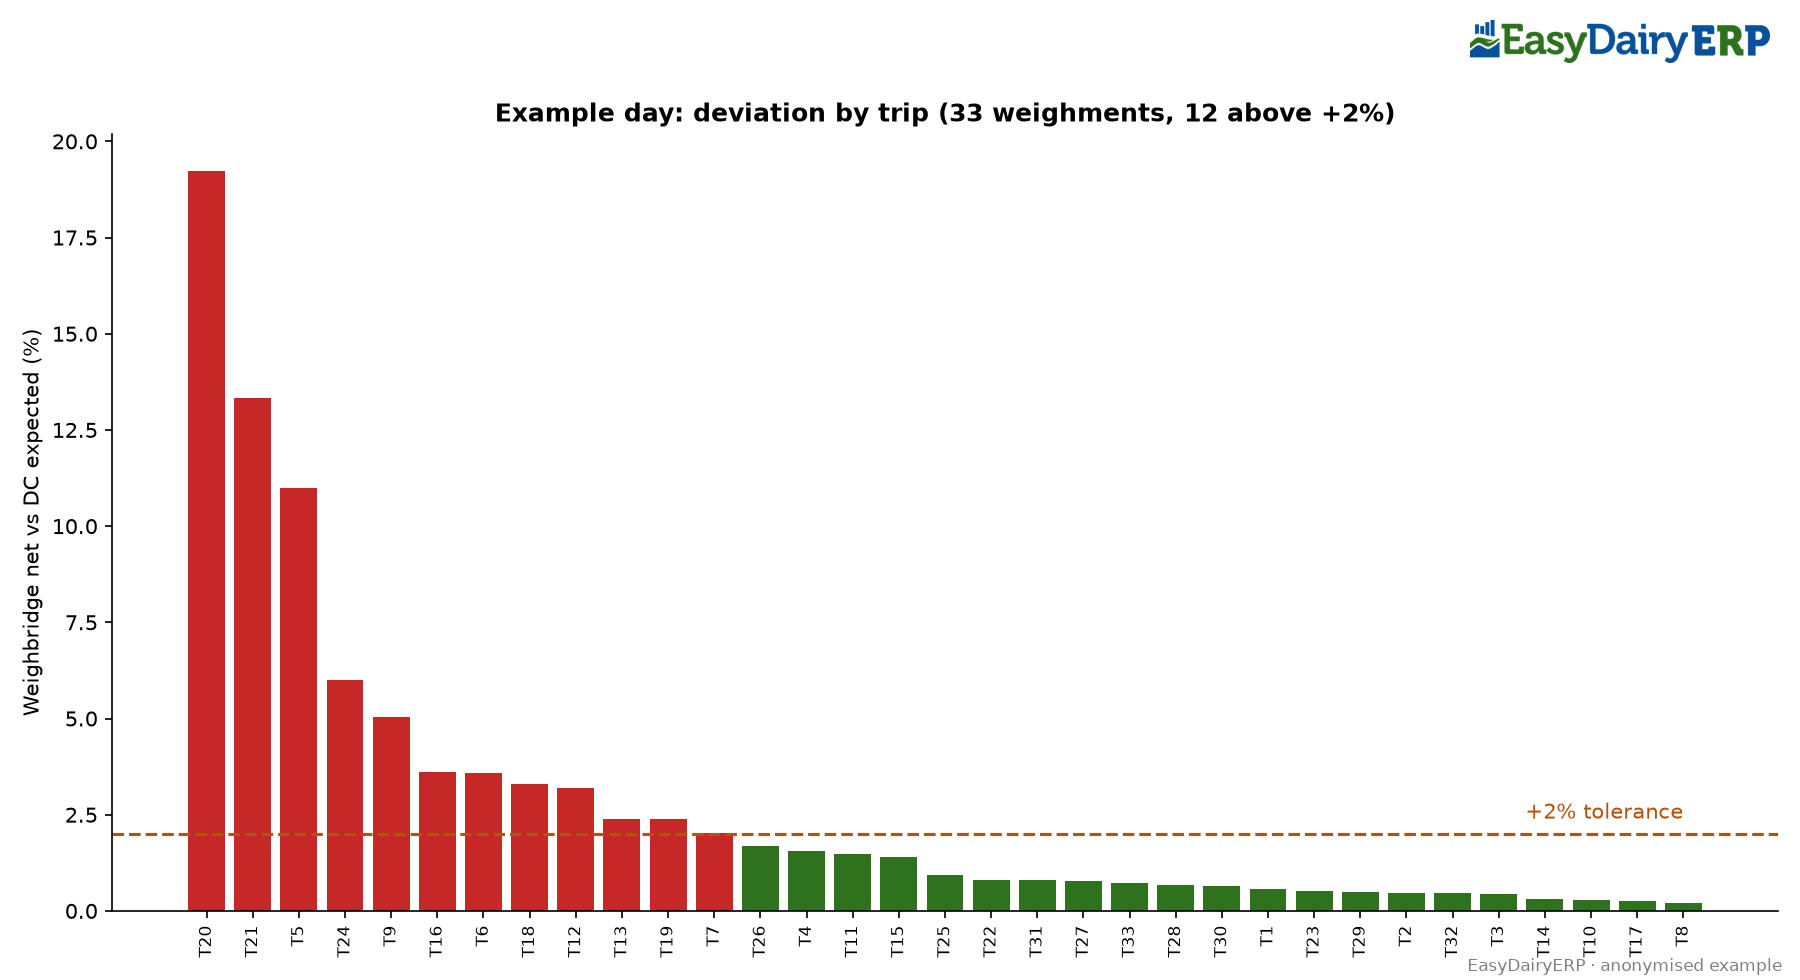
Step 3: the deviation. 6,550 − 6,219.51 = 330.49 kg more on the vehicle than the DCs say: 5.05%. That is about 1,190 pouches’ worth at this load’s average pouch weight. The office entered nothing to explain it (no ice bars, no freezer). Anything beyond ±2% is flagged in red.

What you do: stop or check the vehicle before it leaves, count the crates against the DC, and if the stock is genuine, correct the DC and bill it.
When the extra weight is explained
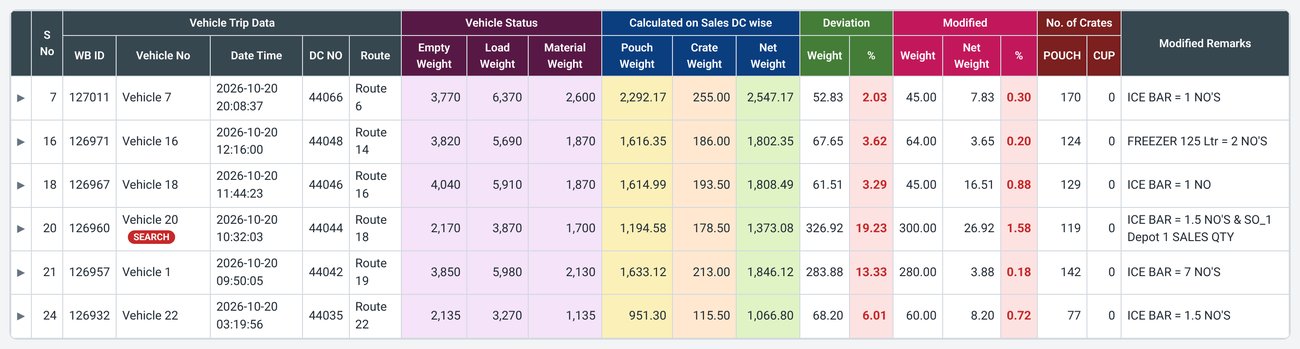
Not every overweight trip is a problem. Vehicles often carry ice bars or a freezer. In the report, the office records these against the weighment with a remark.
“Vehicle 1” on another trip: bridge net 2,130 kg, DC expected 1,846.12 kg, so +283.88 kg (13.33%). The office recorded 7 ice bars = 280 kg, leaving just 3.88 kg (0.18%). That trip is explained.


The whole day at a glance
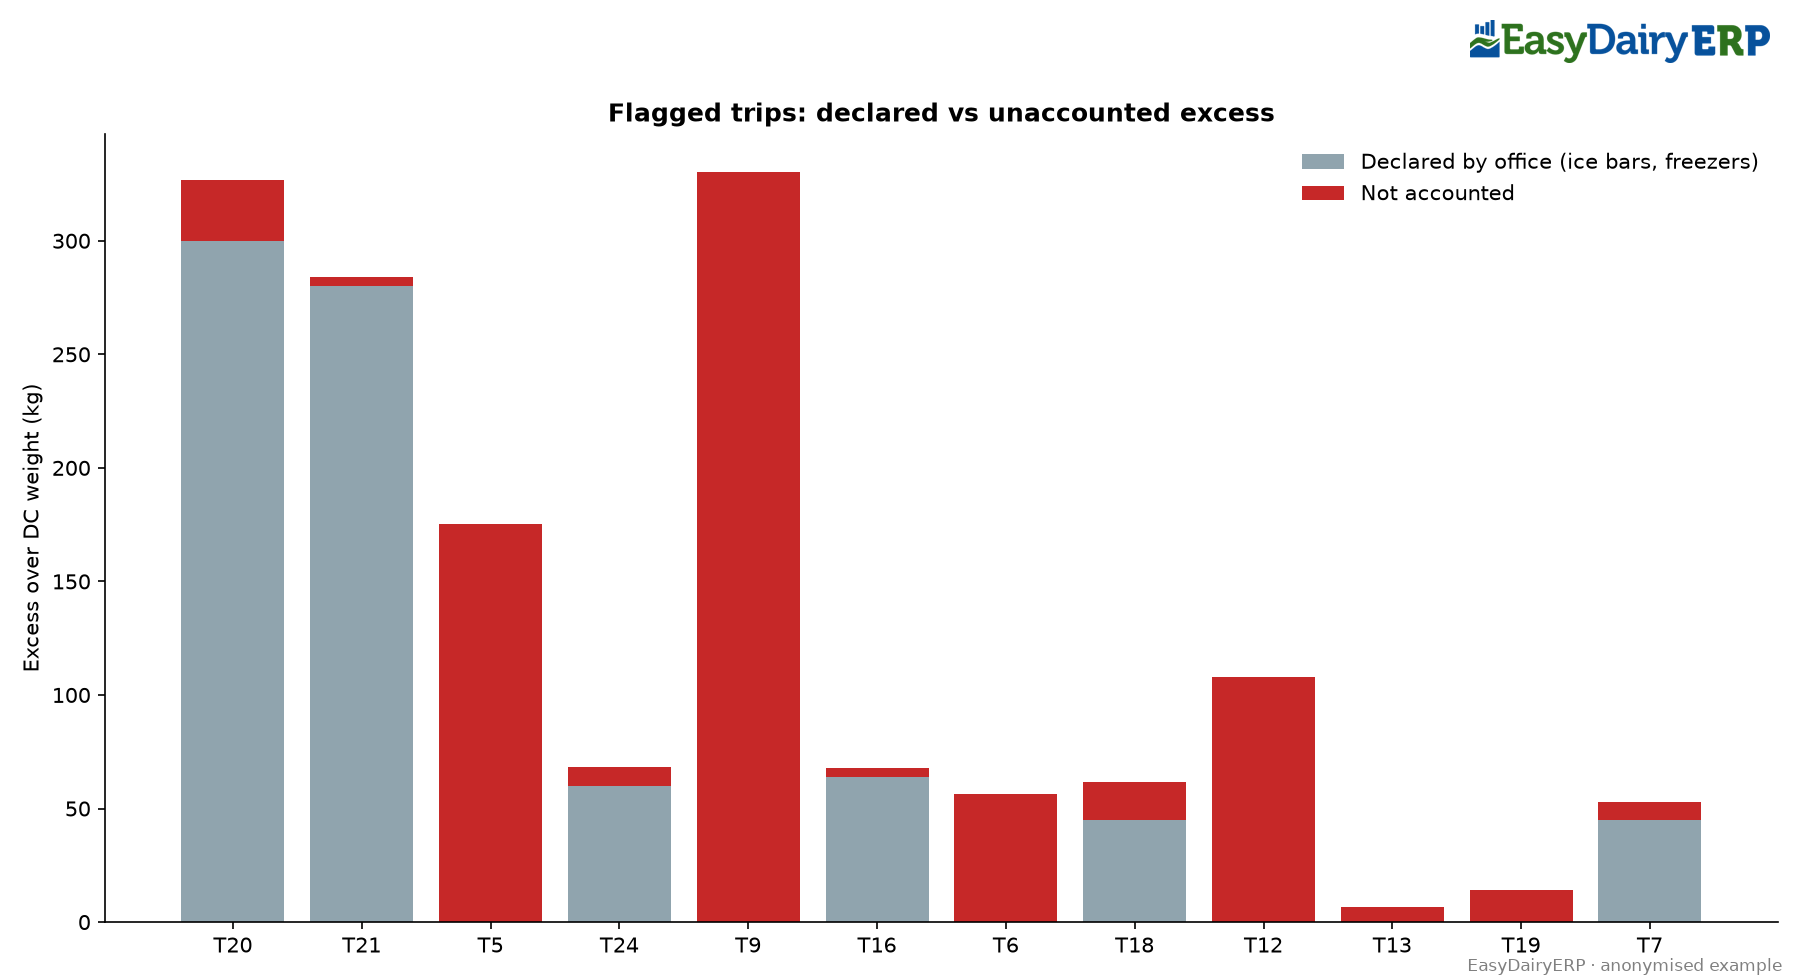
That day: 33 weighments, 21 within ±2%, 12 above +2%, none below. 6 were adjusted by the office. Across all the overweight trips, the office explained 839 kg, and 1,233 kg was left unexplained.

The pattern: repeat offenders
One overweight trip can be an accident. The same vehicle overweight night after night is a pattern. The report lists any vehicle overweight on 60% or more of at least 5 weighments in the last 30 days, or with unexplained excess on 5 or more, as a candidate for a random search.
In this report, one vehicle was overweight on 29 of its last 30 weighments, and another on 20 of 21.
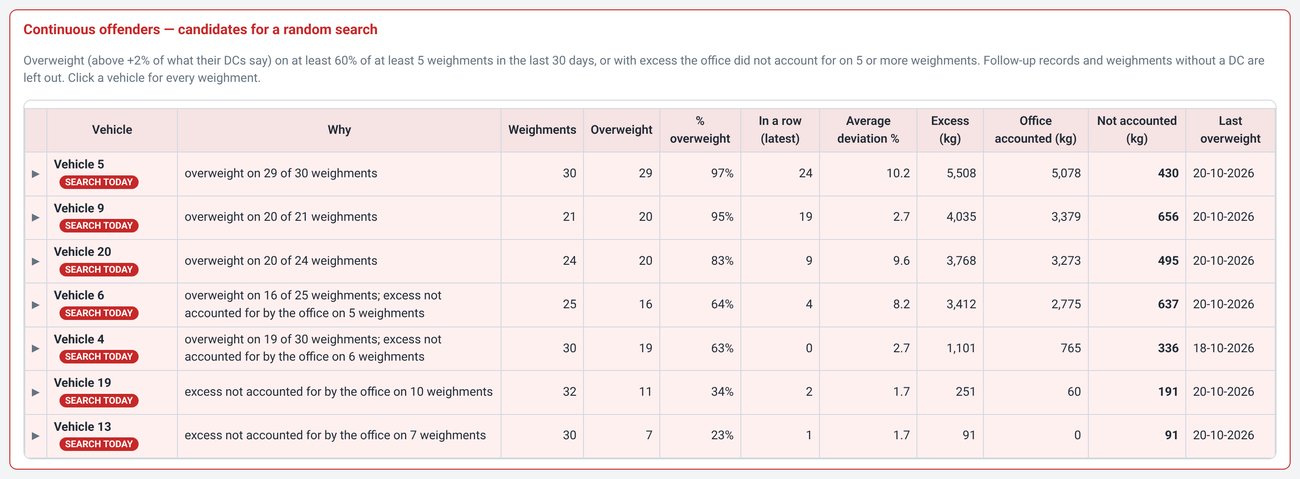
What you do: pick these vehicles for a surprise crate count, ask why the excess isn’t declared, and set a standard ice-bar entry if that is the real reason.
Making sure the master is right
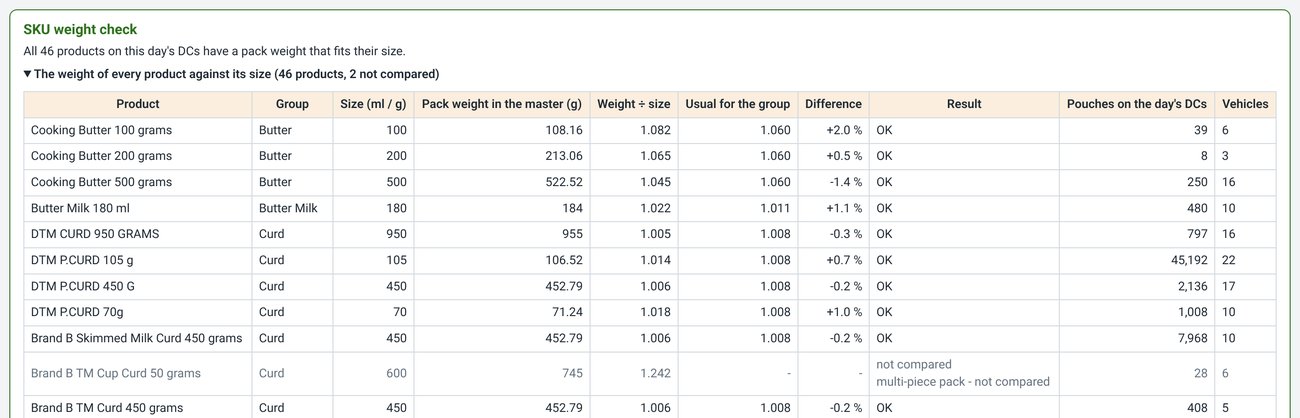
The check is only as good as the pack weights. So the report also compares every product’s pack weight in the master with its size (milk is about 1.03–1.04 g per ml). On this day all 46 products passed, so the flags came from the loads, not from wrong master data.
Features
Bridge net
Loaded weight minus empty weight, taken from the weighbridge for every dispatch vehicle.
Sales / DC weight
Pouches × pack weight (film included) from the pack-weight master, plus 1.5 kg per pouch crate and 2.0 kg per cup crate.
±2% flag
Bridge net against DC weight, in kg and %. Trips beyond ±2% are flagged in red.
Declared extras
Ice bars and freezers recorded by the office against the weighment are deducted before a trip is judged.
Repeat offenders
A 30-day list of vehicles that are overweight again and again, as candidates for a random search.
Pack-weight master check
Every product’s pack weight is checked against its size, so a wrong master does not cause false flags.
Frequently asked questions
±2%. The weighbridge net weight is compared with the weight expected from the vehicle’s DC entries, and any trip beyond ±2% is flagged in red.
Each pouch crate adds 1.5 kg and each cup crate adds 2.0 kg, on top of the pouches × pack weight from the pack-weight master.
The office records them against the weighment with a remark, and the declared weight is deducted. For example, a trip 283.88 kg over with 7 ice bars (280 kg) declared is left with 3.88 kg, so it is explained.
Every DC entered for that vehicle in the 2 hours before weighing.
A 30-day list of vehicles overweight on 60% or more of at least 5 weighments, or with unexplained excess on 5 or more, shown as candidates for a random search.
See it in context
See it live
We walk you through this on our sample data, step by step. Call +91 94880 59495 or write to info@easybis.in.