
Sales Screens
The sales screens and reports in one place: live dashboards, comparisons, customer transactions, variant trends, GST, incentives, ledgers, credit flow and pouch costing.
The sales screen gallery, with each screen explained: what it shows and who uses it.
On this page
Dashboards
Live dashboard and 7-day trendComparisons
Route and customer comparisons and transactionsProducts
Variant-wise trends and production vs salesTax and ledgers
GSTR-1, incentives, ledgers and credit flowCosting
Pouch costing and SKU costingMore
Frequently asked questionsDashboardsLive dashboard and 7-day trend
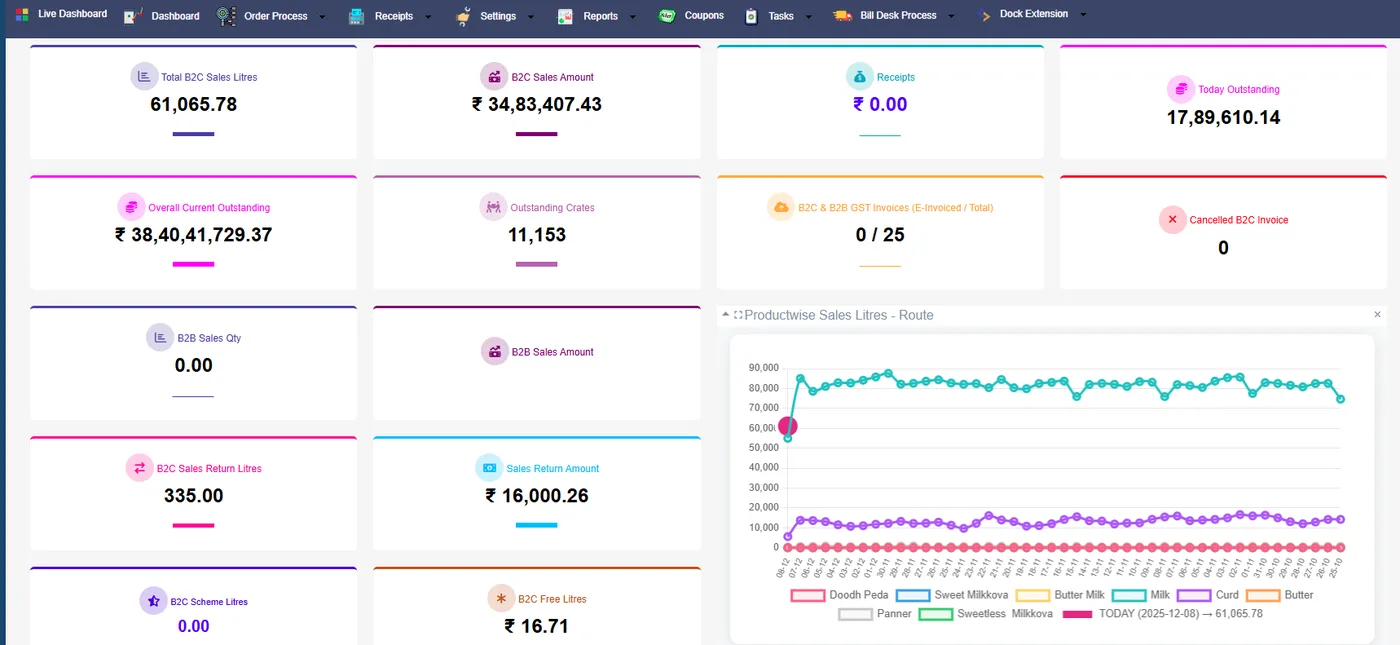
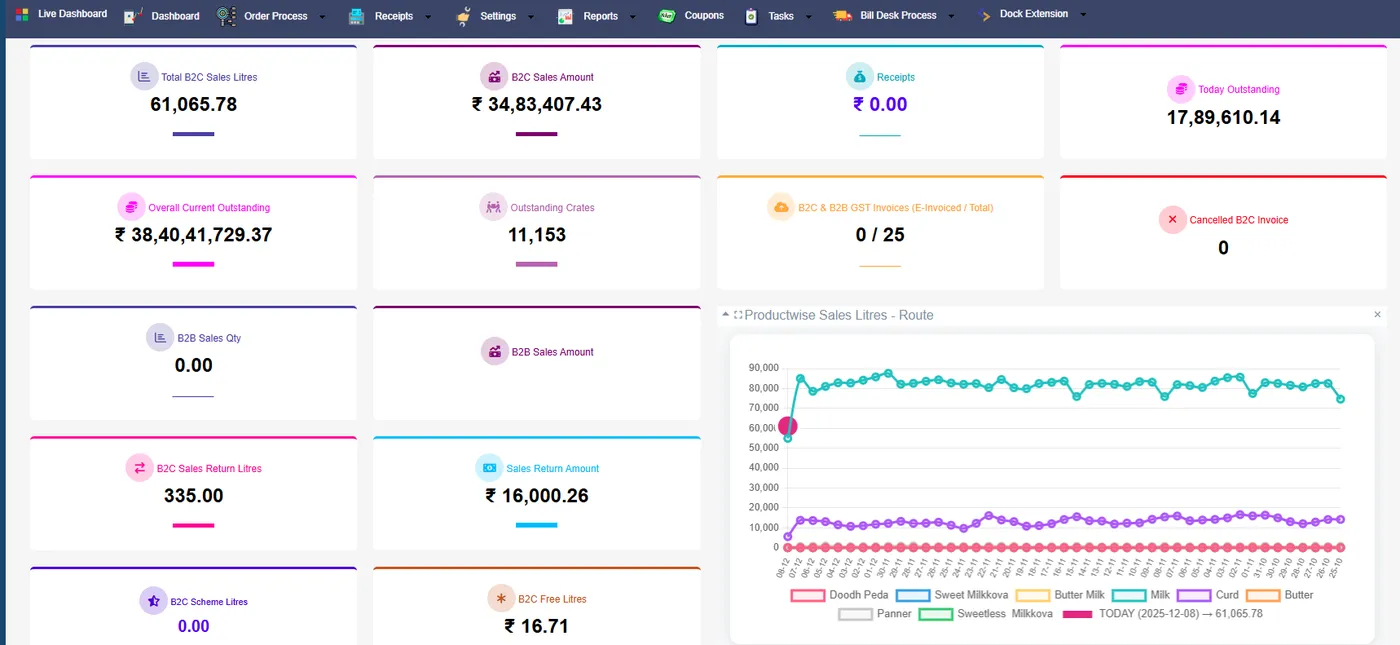
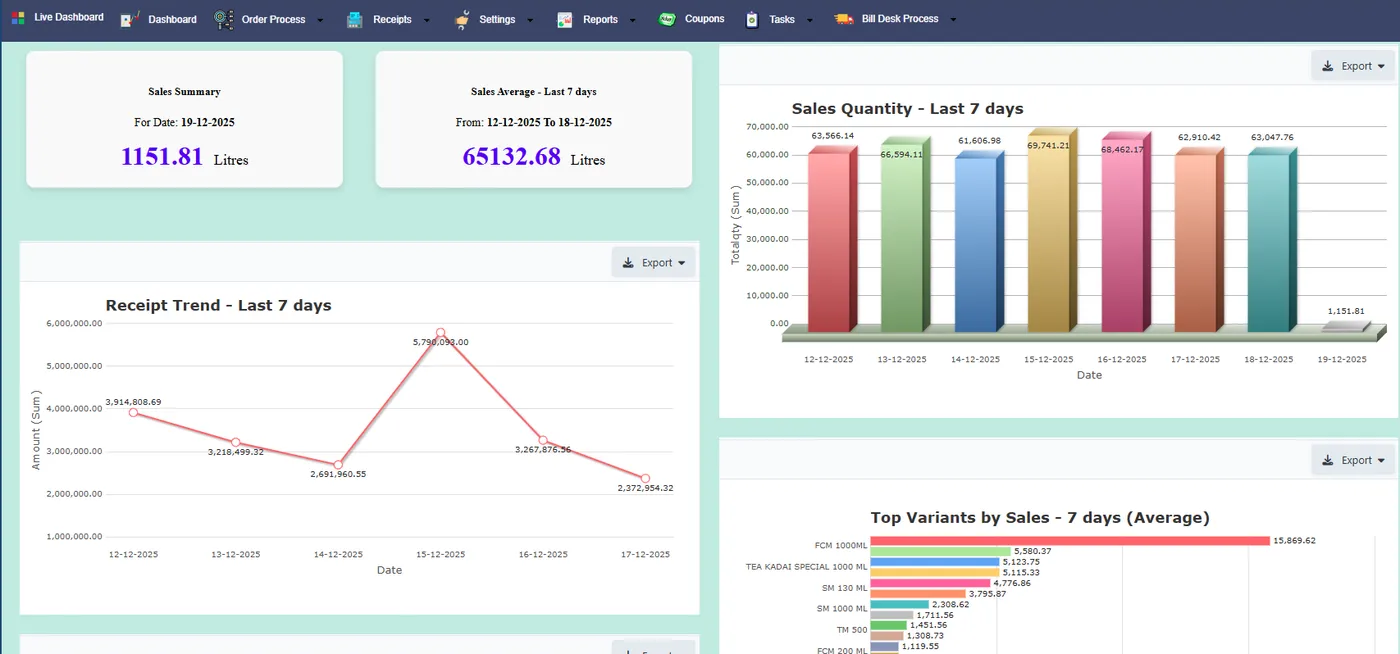
The Sales Live Dashboard shows the day’s sales as they are billed; the 7 Days Trend Dashboard shows the week.
They are the sales head’s first look of the day and lead into the comparisons below.
Both dashboards draw on the same invoices as the GST and ledger reports, so the figure on the dashboard is the figure accounts will close the day with. Clicking through moves from the total to the dock, route and customer.
- Sales Live Dashboard; Sales 7 Days Trend Dashboard
ComparisonsRoute and customer comparisons and transactions
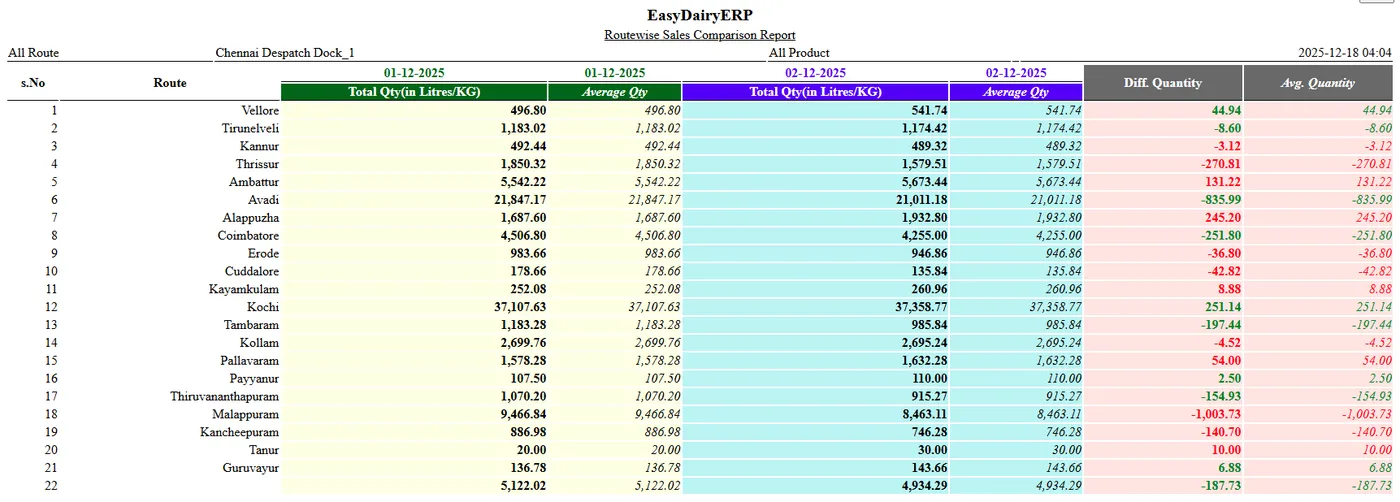
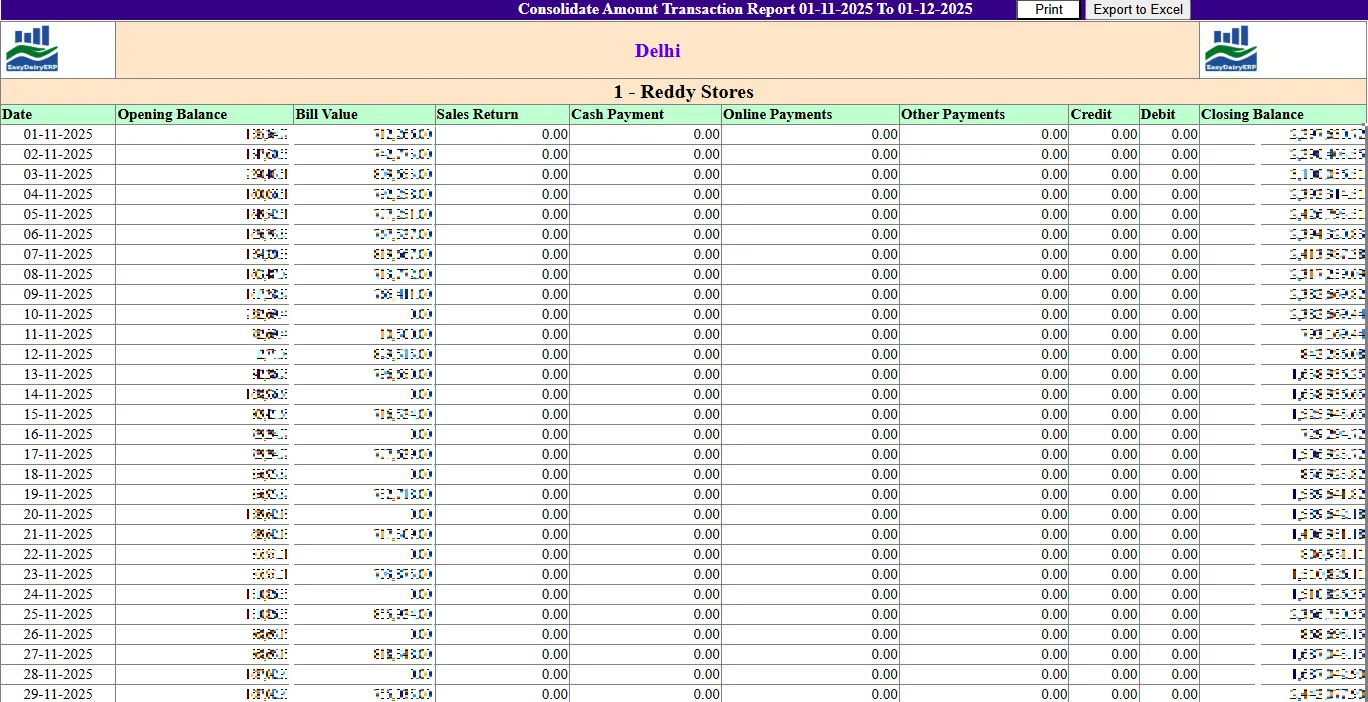
The Sales Comparison Report compares route-wise and customer-wise; the Customer Amount Transaction Report includes the last 30 days.
Together they show which routes and customers grew or fell and how much they paid.
The comparison is used in review meetings to decide which routes need attention, and the transaction report is used by collection staff to follow up on payments before the next dispatch.
- Sales Comparison Report route-wise and customer-wise
- Customer Amount Transaction Report (incl. last 30 days)
ProductsVariant-wise trends and production vs sales
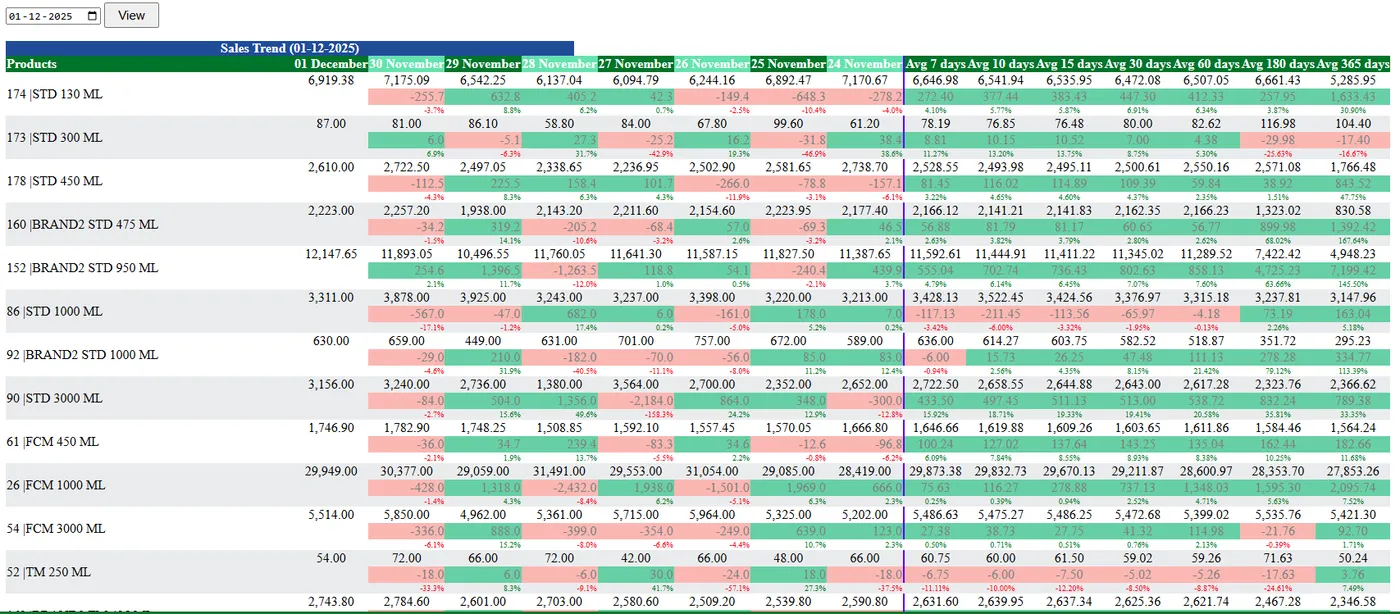
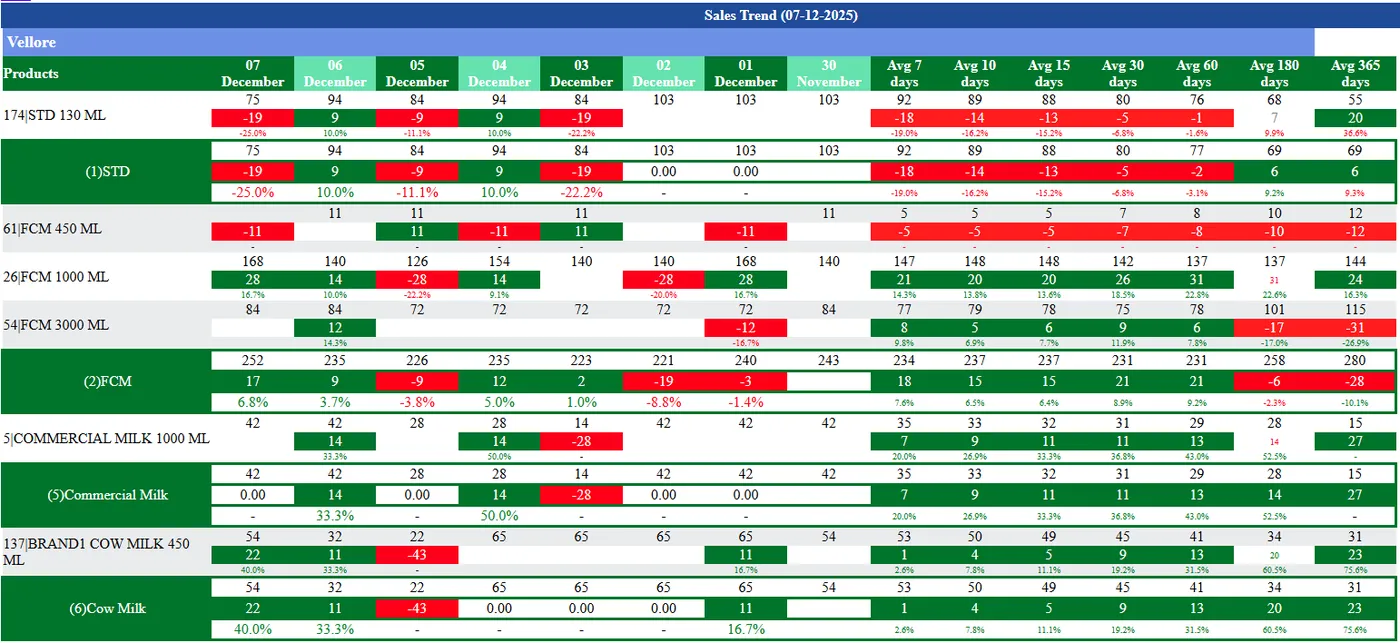
The Variant-wise Sales Trend shows each variant across all SKUs and by route.
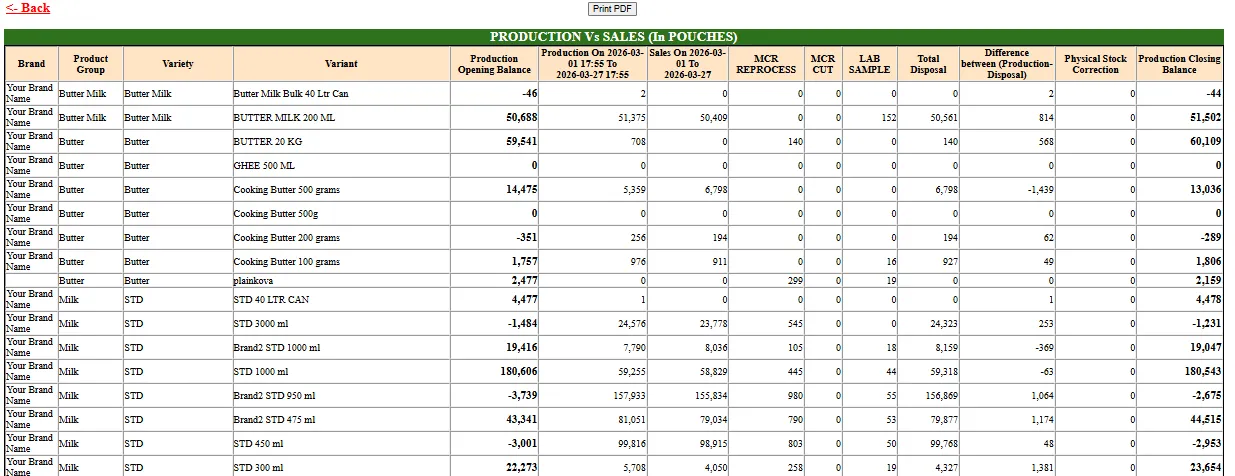
Production versus sales pouch stock compares what was packed with what was sold.
Variant trends show which pack sizes and varieties are growing on which routes, which feeds the production run plan and the dispatch plan for the coming days.
- Variant-wise Sales Trend
Tax and ledgersGSTR-1, incentives, ledgers and credit flow
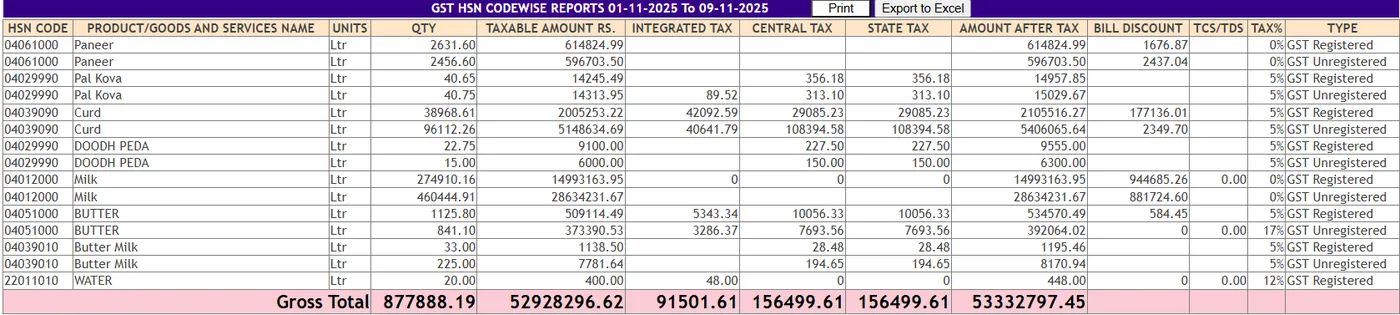
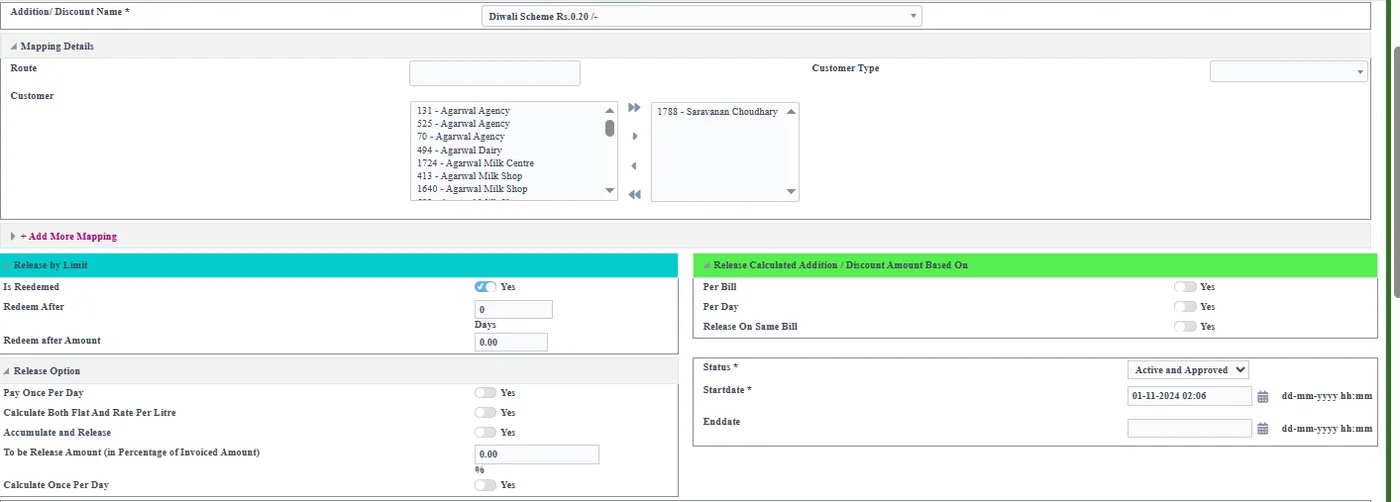
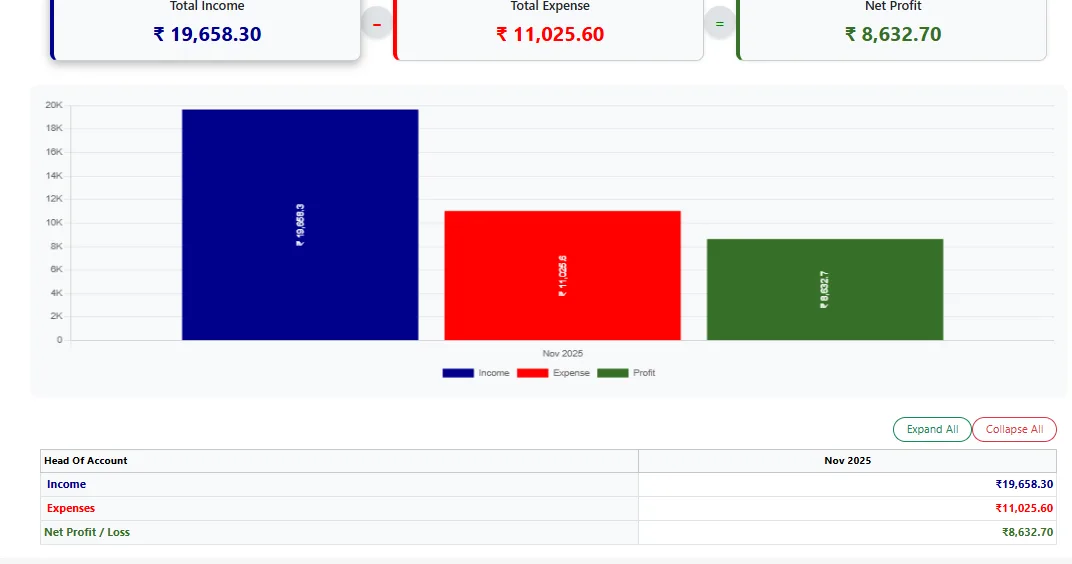
GSTR-1 is reported HSN-wise and customer-wise. The Incentive or Discount Statement and the Incentive Type-wise Report show what was given; the Customer Ledger and Customer Transaction Report show each account; Overall Credit Flow shows credit across customers.
Accounts use these to close the month and check every incentive against its scheme.
Every one of these reports is produced from the day’s billing, receipts and schemes, so there is no separate workbook to maintain and no re-keying before filing or audit.
- GSTR-1 Report HSN-wise and customer-wise
- Incentive or Discount Statement; Incentive Type-wise Report
- Customer Ledger; Customer Transaction Report
- Overall Credit Flow
CostingPouch costing and SKU costing
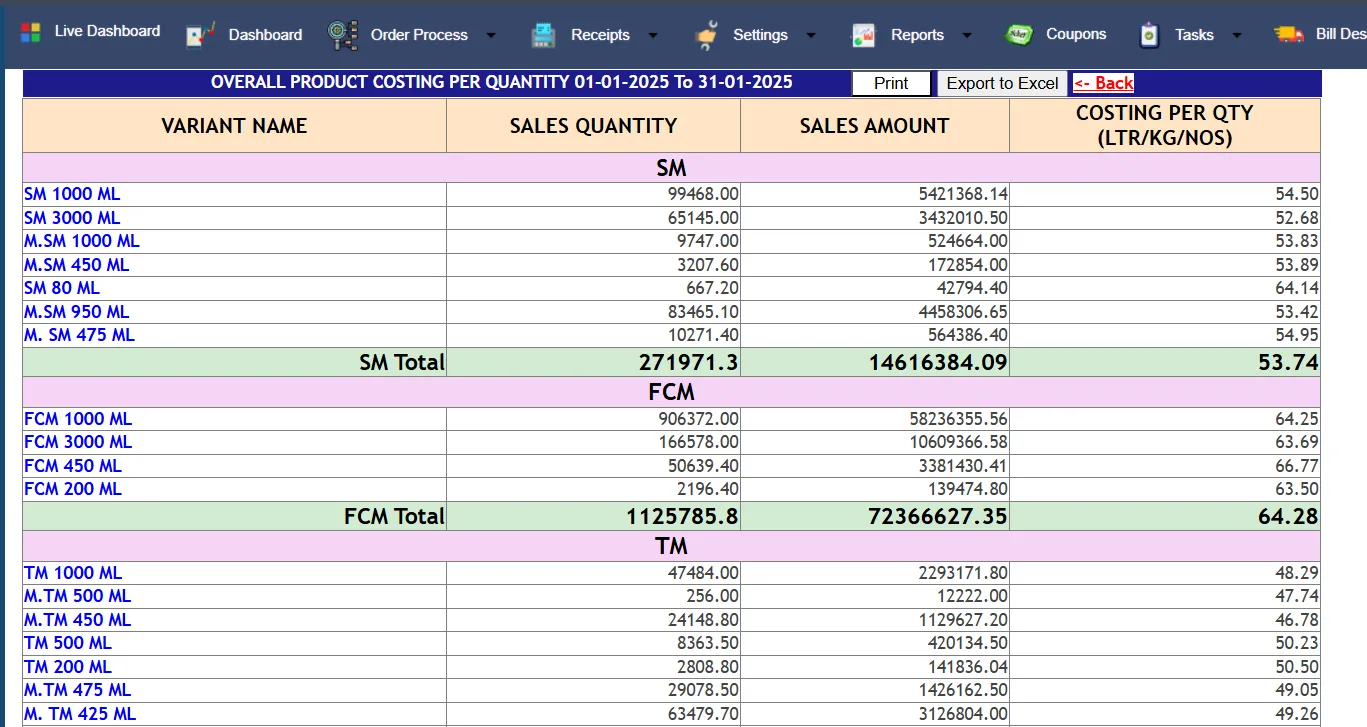
The Pouch Costing Report and monthly costing show the cost of each pouch; SKU costing per quantity breaks it down.
They connect the sales price to the production cost, product by product.
Costing reports sit beside the sales reports so that the margin conversation uses the same product list, the same period and the same quantities as the sales figures.
- Pouch Costing Report
- Monthly costing / pouch costing
FAQFrequently asked questions
Are these on mobile?
Many sales views are also on the EasyDairyERP app; see Sales and Marketing Mobile Application.
Keep exploring at your own pace
Every module page walks through the screens, reports and mobile apps in the same way, so you can see exactly how EasyDairyERP fits your dairy.
When you have seen enough, we are happy to show it to you live on our sample data: book a demo or call +91 94880 59495.