
Procurement Screens
The procurement screens in one place: dashboards, AMCC versus chilling centre differences, receipts, consolidated reports, invoice and cost analysis, comparisons and transport costs.
This page is the procurement screen gallery, with each screen explained: what it shows, how it is used and who uses it. All are web screens in EasyDairyERP; most have a phone version on the Procurement Mobile Application.
On this page
Dashboards
Plant versus centre difference and the last 7 daysDifferences
AMCC versus chilling centre differenceReceipts
CC receipts, landing TSR and day and shift consolidationCosts
AMCC cost, centre and plant invoices, and inward transportComparisons
Bills, dates, vendors and routes comparedMasters on screen
Rate charts and mappingsMore
Frequently asked questionsDashboardsPlant versus centre difference and the last 7 days
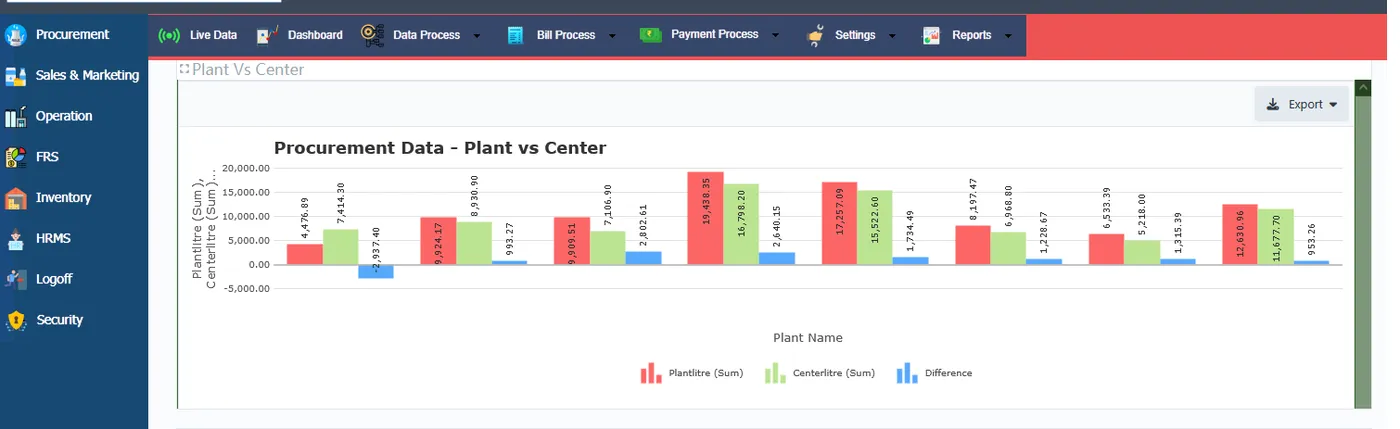
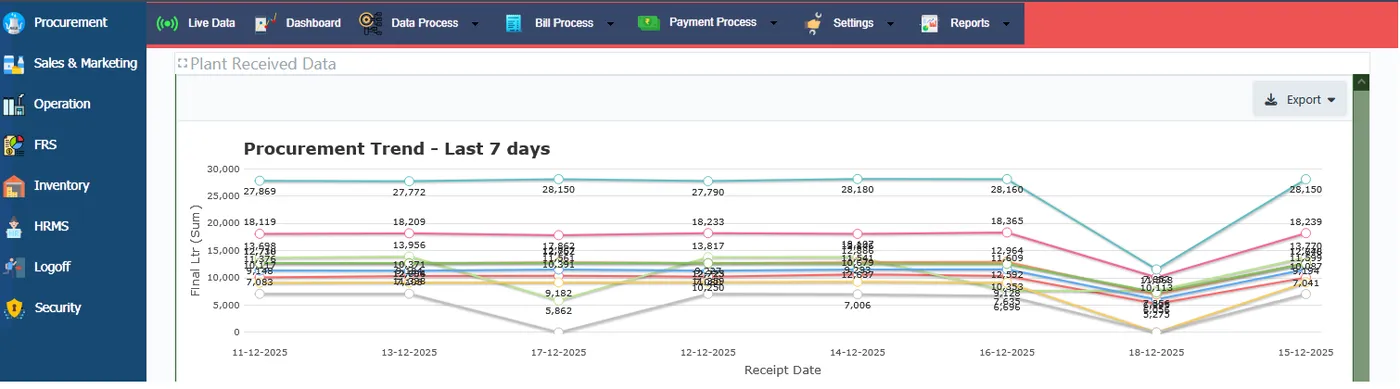
The Plant vs Center Difference dashboard compares what the plant received with what the centres recorded, so differences surface without a separate reconciliation. The Last 7 Days Trend shows the week’s procurement volume day by day.
Both dashboards are the first screens a procurement head opens in the morning; any difference or dip they show is then followed into the difference and receipt reports below.
- Plant vs Center Difference dashboard
- Last 7 Days Trend
DifferencesAMCC versus chilling centre difference
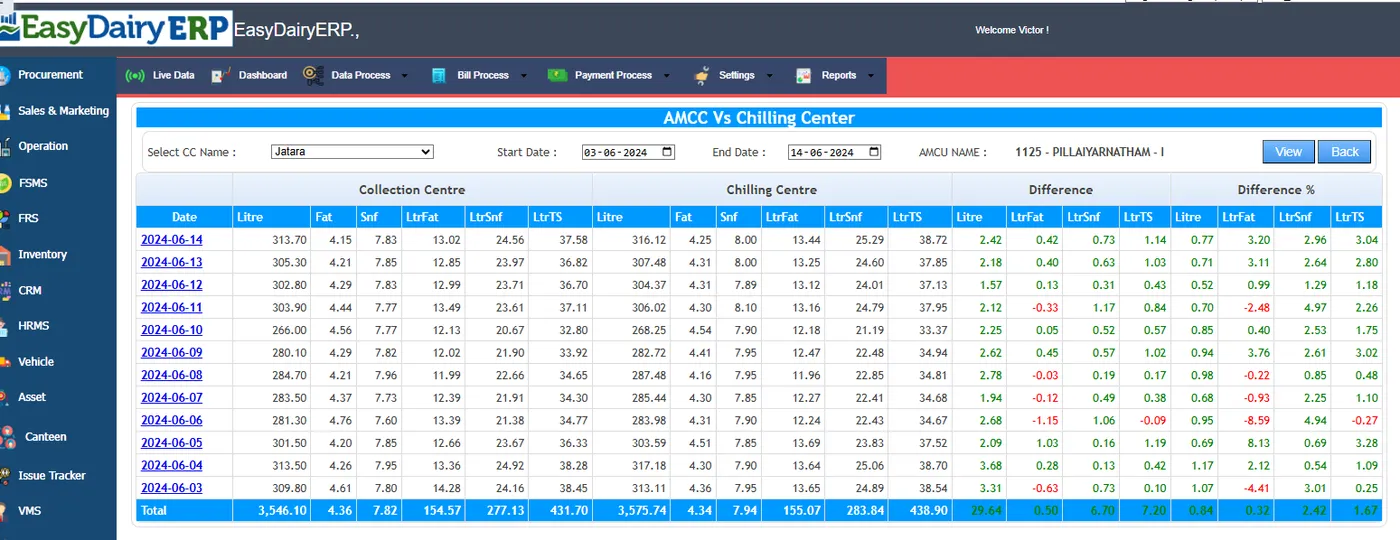
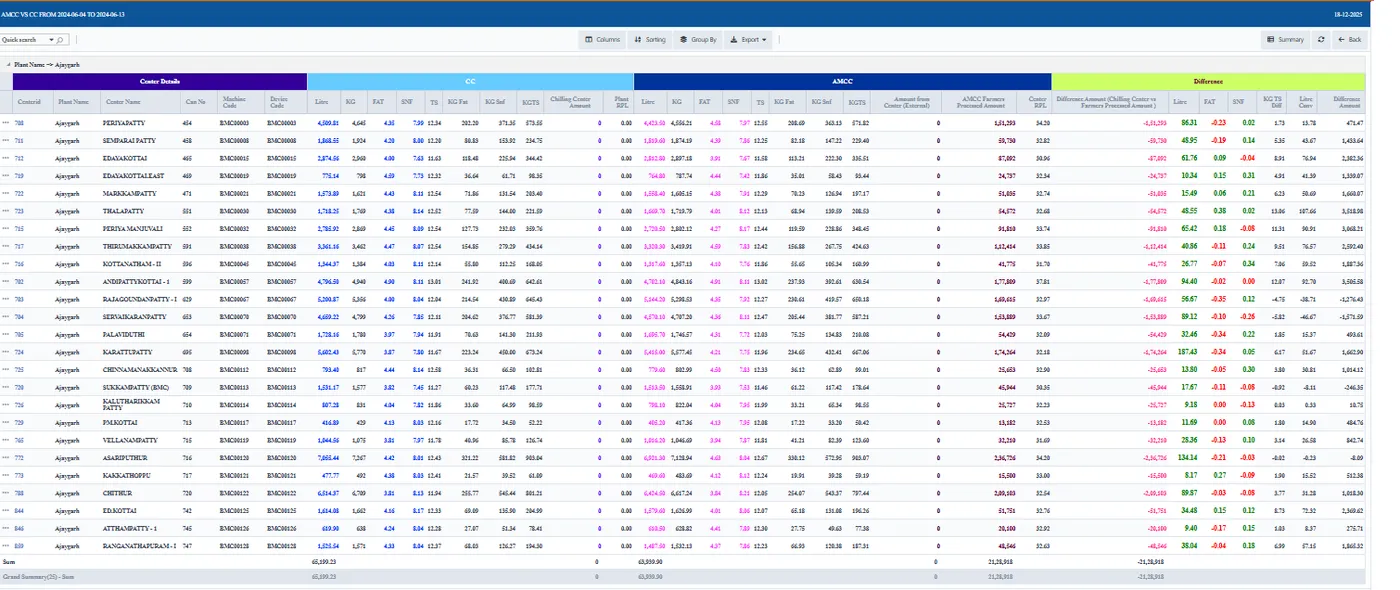
The AMCC vs Chilling Center Difference report compares village-centre data with chilling centre data date by date, and the version with amount puts a value on each difference. Together with TS matching, these are the reports used to find where milk or solids went missing.
Because the report is date-wise, a difference can be followed back to the day it started and the centre where it happened, and then to the corrections and approvals made on that day.
- AMCC vs Chilling Center Difference (date-wise; with amount)
ReceiptsCC receipts, landing TSR and day and shift consolidation
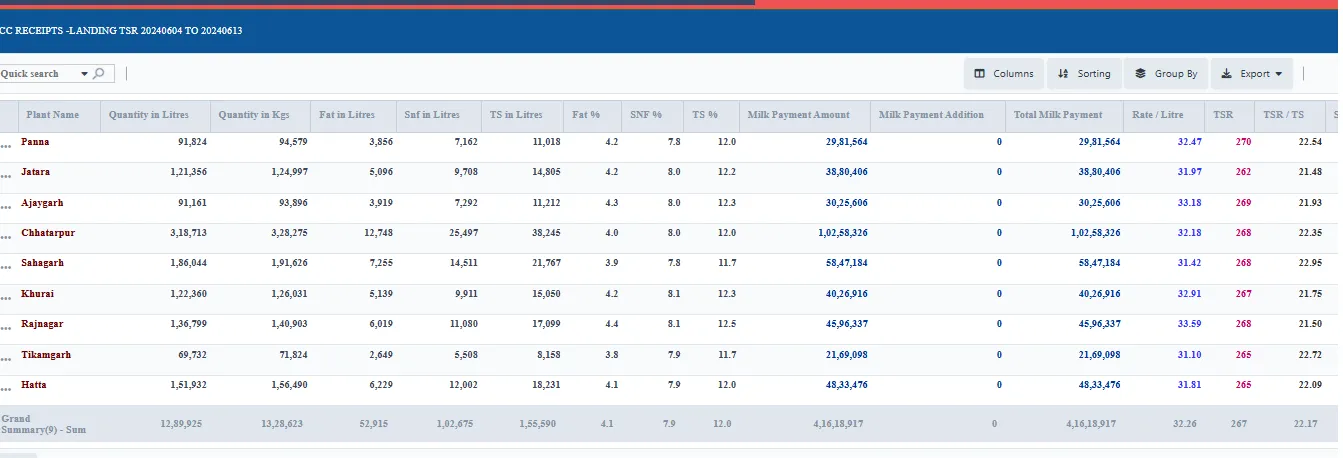
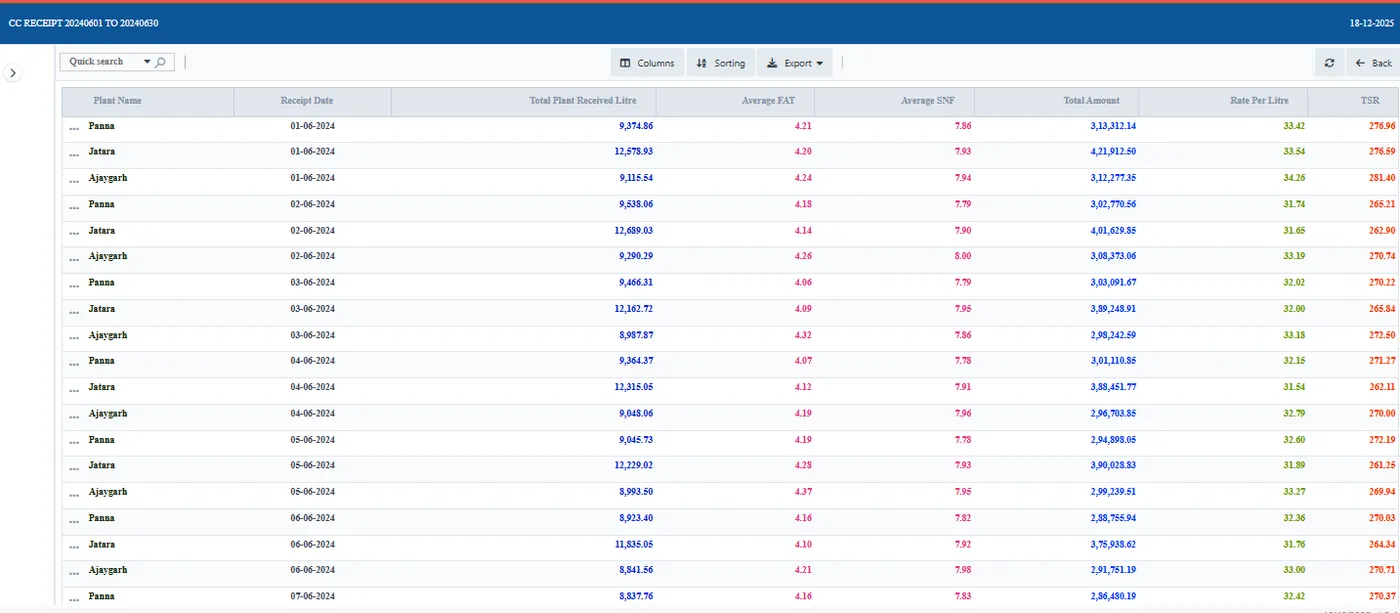
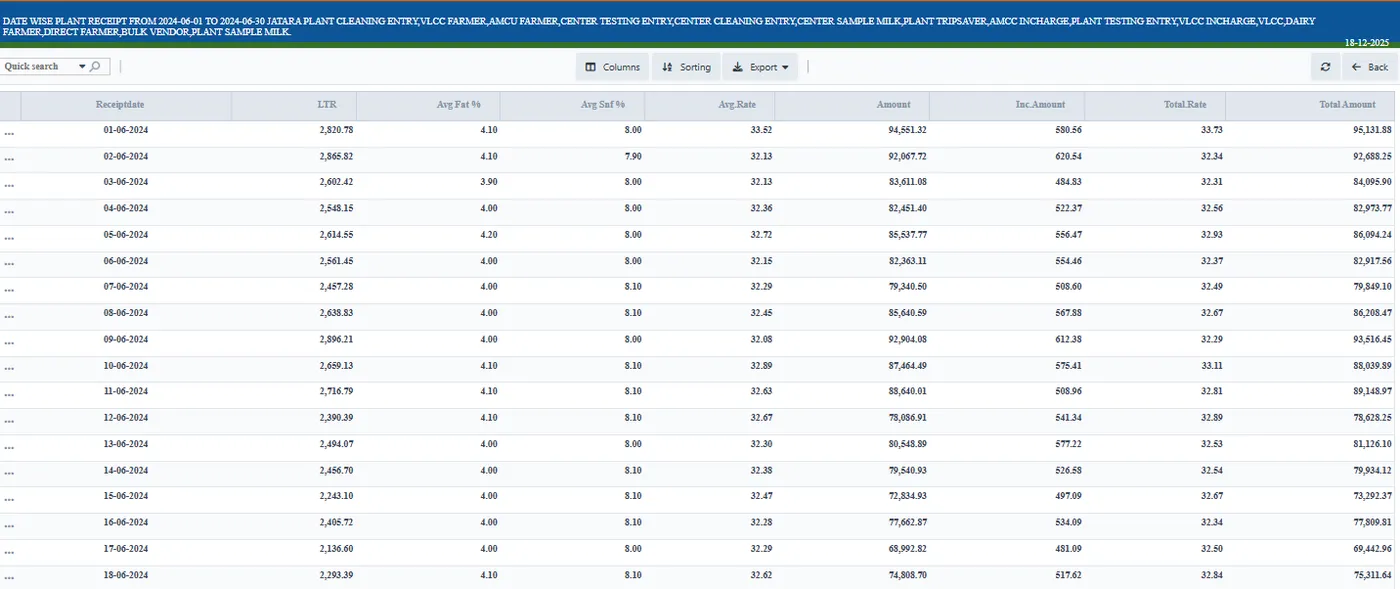
CC Receipts Landing TSR shows the chilling centre receipts with the landing total-solids rate; Day-wise CC Receipt with Amount values them. The Day & Shift-wise Consolidated Report pulls every centre into one view per day and shift, and the day-wise plant receipt consolidates what the plant received.
Accounts use these reports to check the chilling centre purchase against what was dispatched and what the dairy acknowledged, before bills and charges are finalised.
- CC Receipts Landing TSR; Day-wise CC Receipt with Amount
- Day & Shift-wise Consolidated Report
CostsAMCC cost, centre and plant invoices, and inward transport
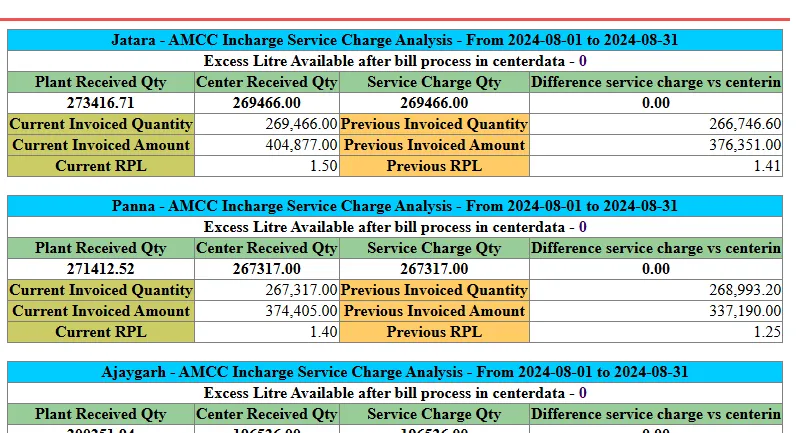
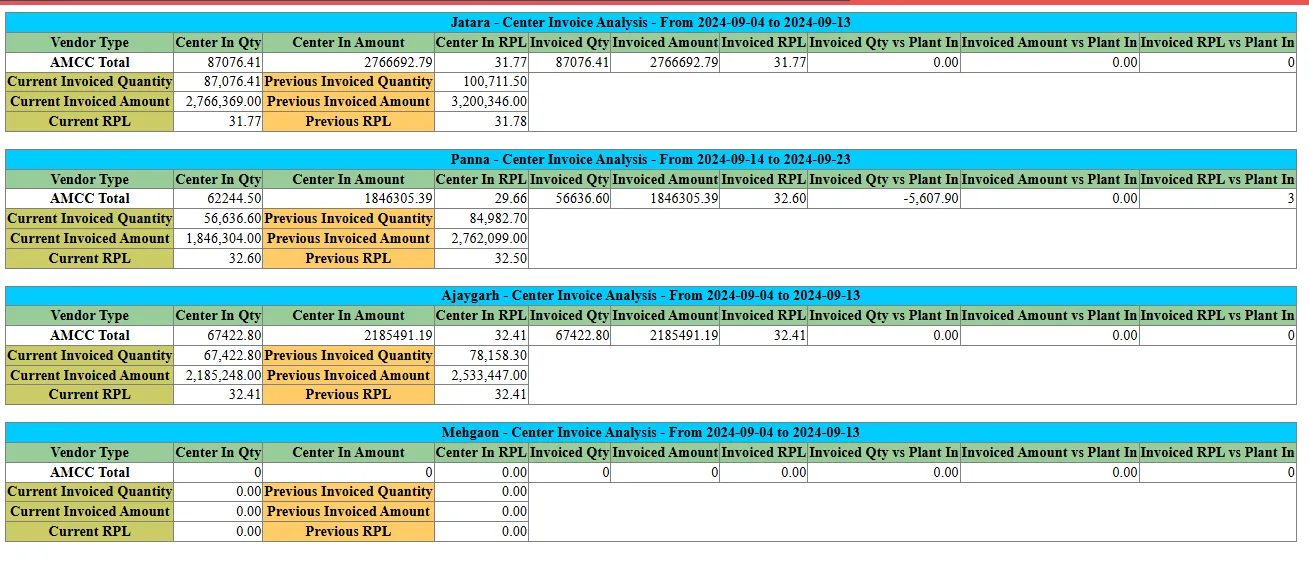
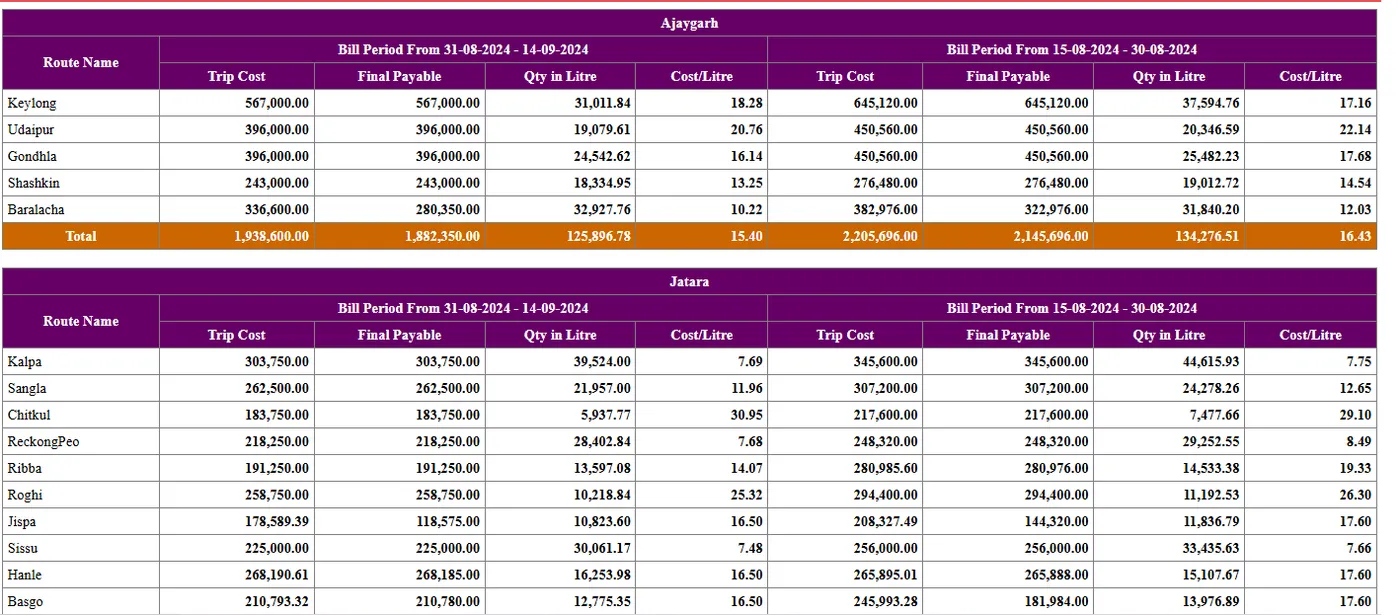
AMCC Cost Analysis shows what running each automated collection centre costs. Center and Plant Invoice Analysis covers the invoices raised by centres and plants. The Inward Transport Cost Analysis report shows what each route’s inward transport costs, from the trips and contract rates.
Read together, they show the full cost of bringing milk in: the centre, the invoice and the transport, route by route.
- AMCC Cost Analysis
- Center and Plant Invoice Analysis
- Inward transport cost analysis report
ComparisonsBills, dates, vendors and routes compared
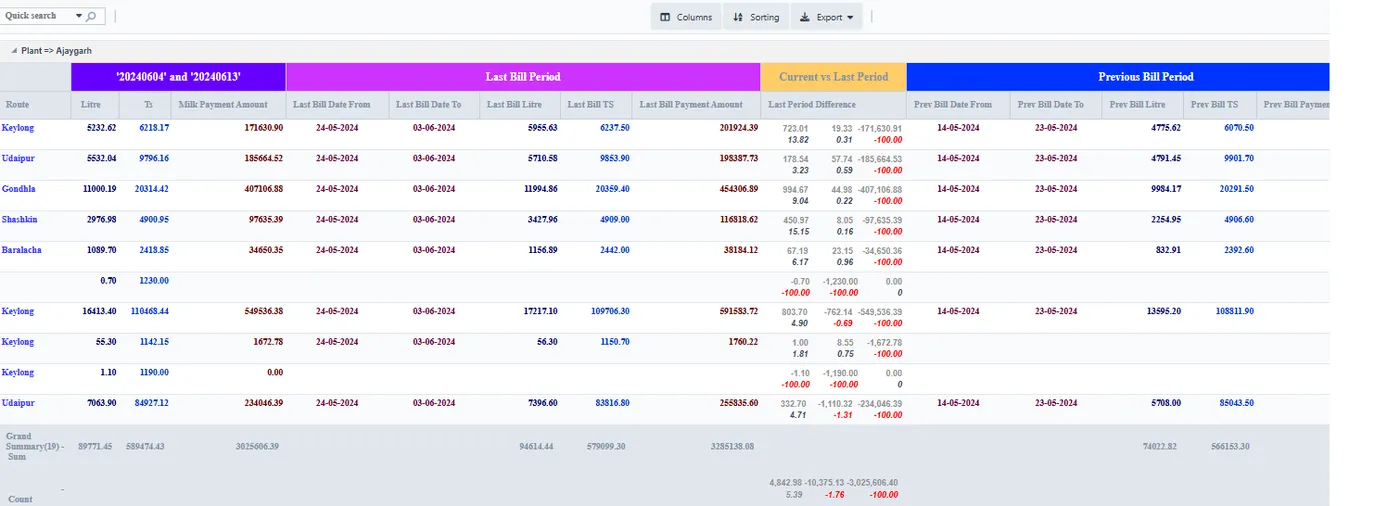
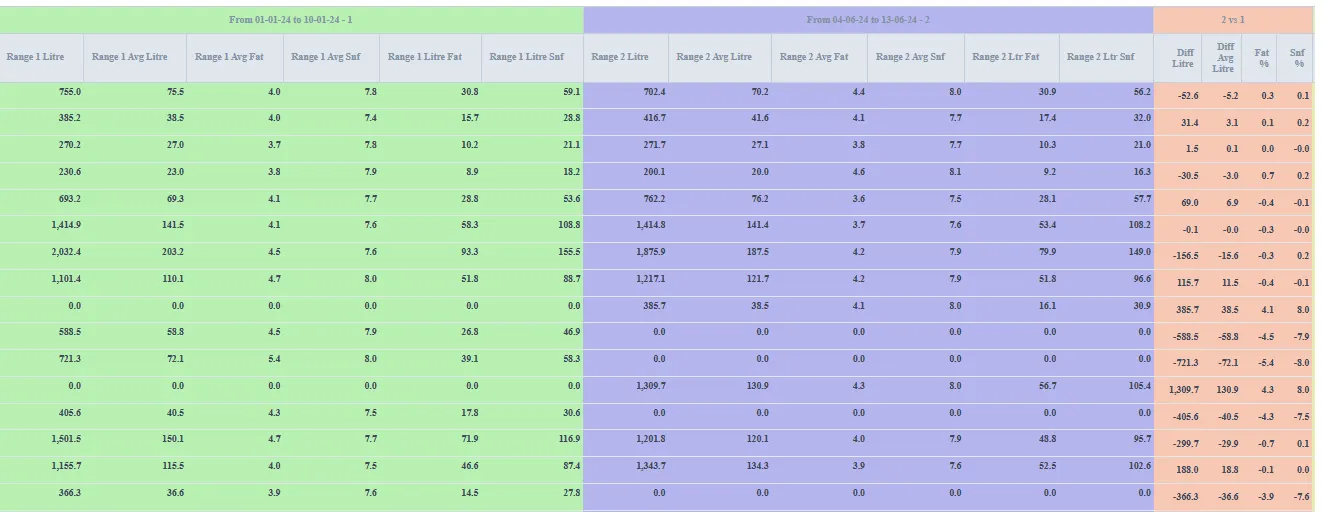
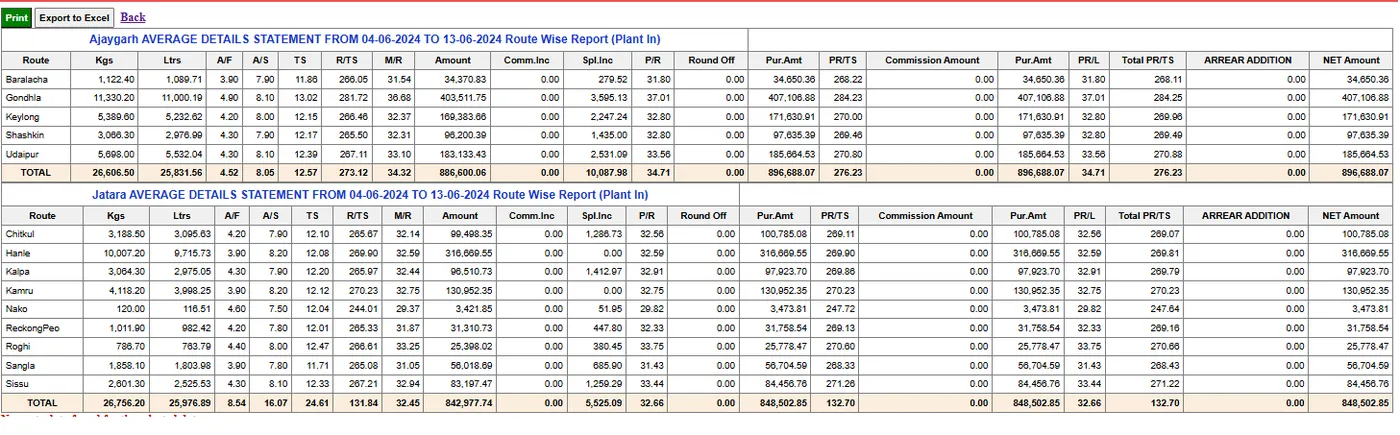
Last Two Bill Comparison shows how each vendor’s bill moved between cycles; the Three Date-wise Comparison puts three dates side by side. The Plant-In Vendor Comparison compares vendors delivering directly to the plant, and the Route-wise Average Statement gives each route’s averages.
These comparisons are used before a bill is released, to spot vendors whose bills moved unusually, and when routes are reviewed, to compare their averages.
- Last Two Bill Comparison; Three Date-wise Comparison
- Plant-In Vendor Comparison
- Route-wise Average Statement
Masters on screenRate charts and mappings
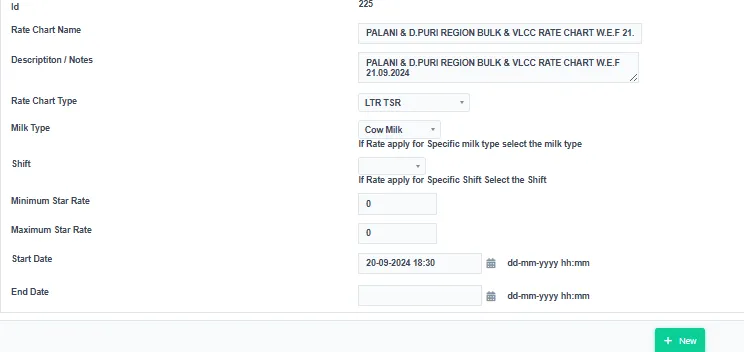
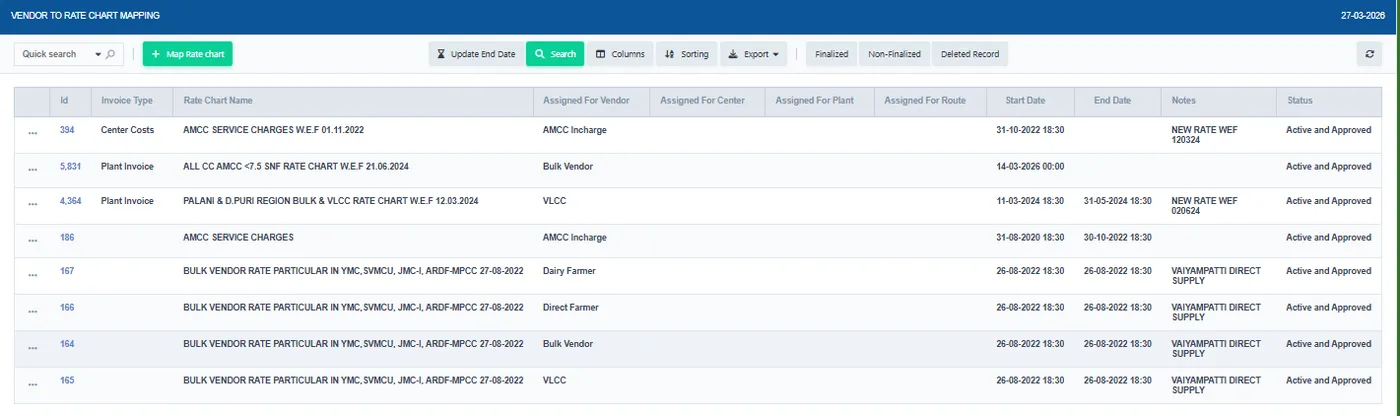
The rate chart screens: the rate chart master, the FAT and SNF rate chart, and the mappings to routes, vendors and vendor types. See Easy Procurement for how rate charts work.
Seeing the masters next to the reports helps explain any bill: the rate chart and its mapping are the starting point for every amount on these screens.

FAQFrequently asked questions
Are these real screens?
Yes, from EasyDairyERP, with names blurred where they appeared.
Are they on mobile too?
Most procurement dashboards are also on the EasyDairyERP app; see Procurement Mobile Application.
Keep exploring at your own pace
Every module page walks through the screens, reports and mobile apps in the same way, so you can see exactly how EasyDairyERP fits your dairy.
When you have seen enough, we are happy to show it to you live on our sample data: book a demo or call +91 94880 59495.