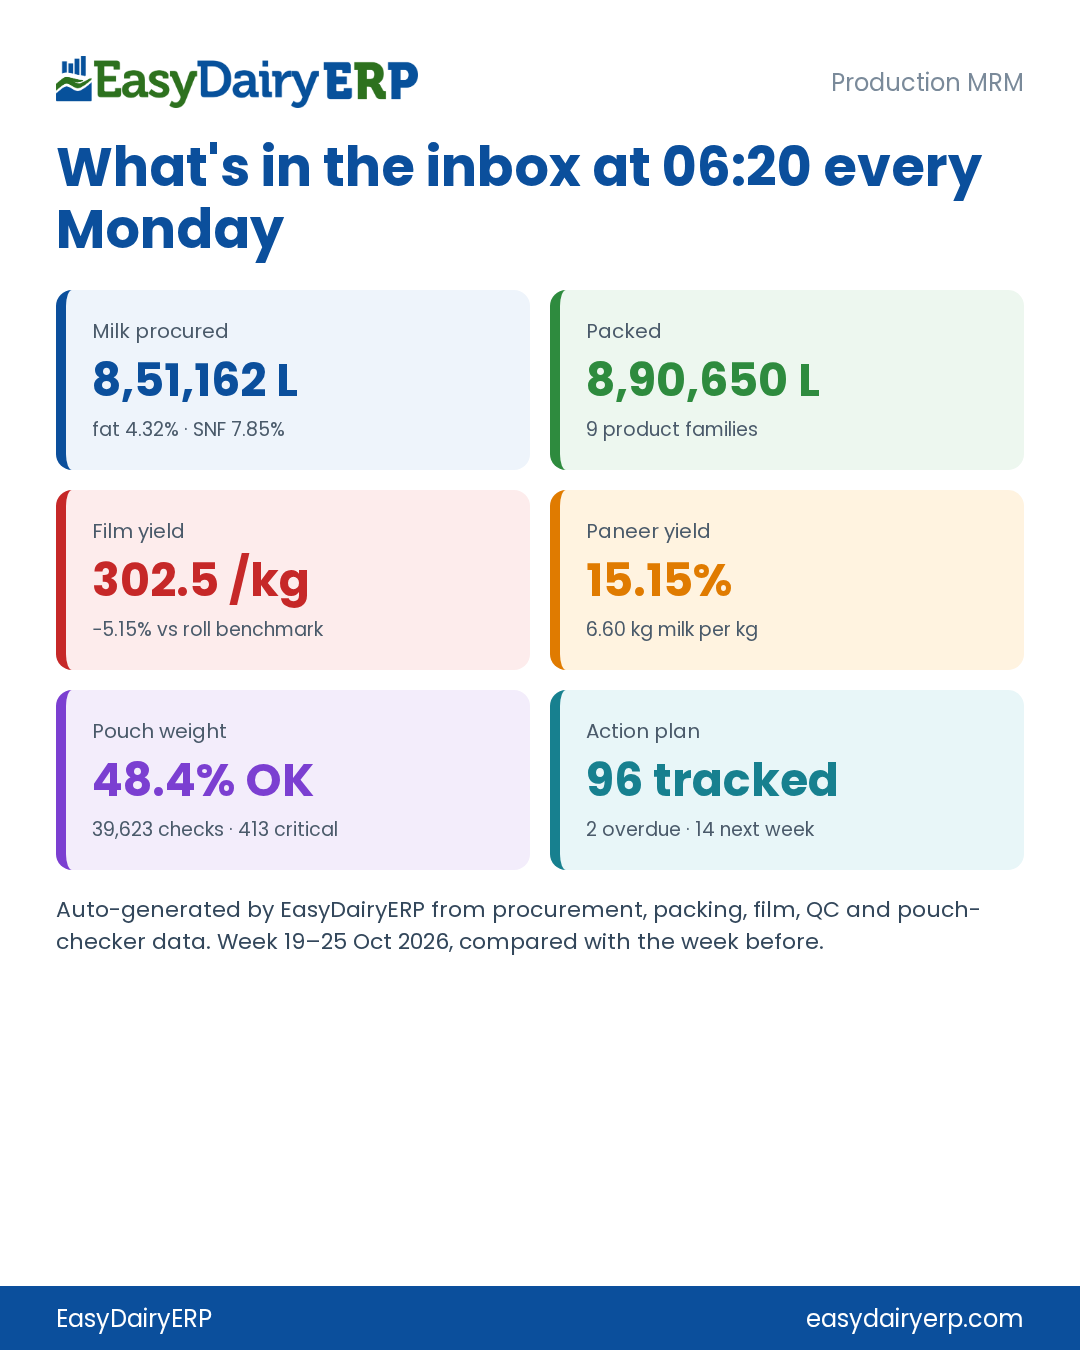
The weekly production MRM report in EasyDairyERP is an automatic management review of the plant’s week. Every Monday at 06:20 it mails the plant head one review covering milk procured, packed and sold, the total-solids balance, film use, paneer yield, pouch weights and the action list, each compared with the previous week. Nobody has to build it from spreadsheets on Sunday night.
Weekly Production MRM at a glance (one example week)
The screenshots and figures on this page are from one real week (19–25 October 2026) at a dairy using EasyDairyERP. Names have been removed and money figures are not shown.
What arrives
One mail, three tabs, before the meeting
Most production reviews are put together on Sunday night from five spreadsheets. With EasyDairyERP, the review is already in the plant head’s inbox at 06:20 on Monday.
The mail has three tabs: a one-page summary, the full report, and an interactive cost sheet. Every figure is shown next to the previous week, so the meeting starts with what changed.
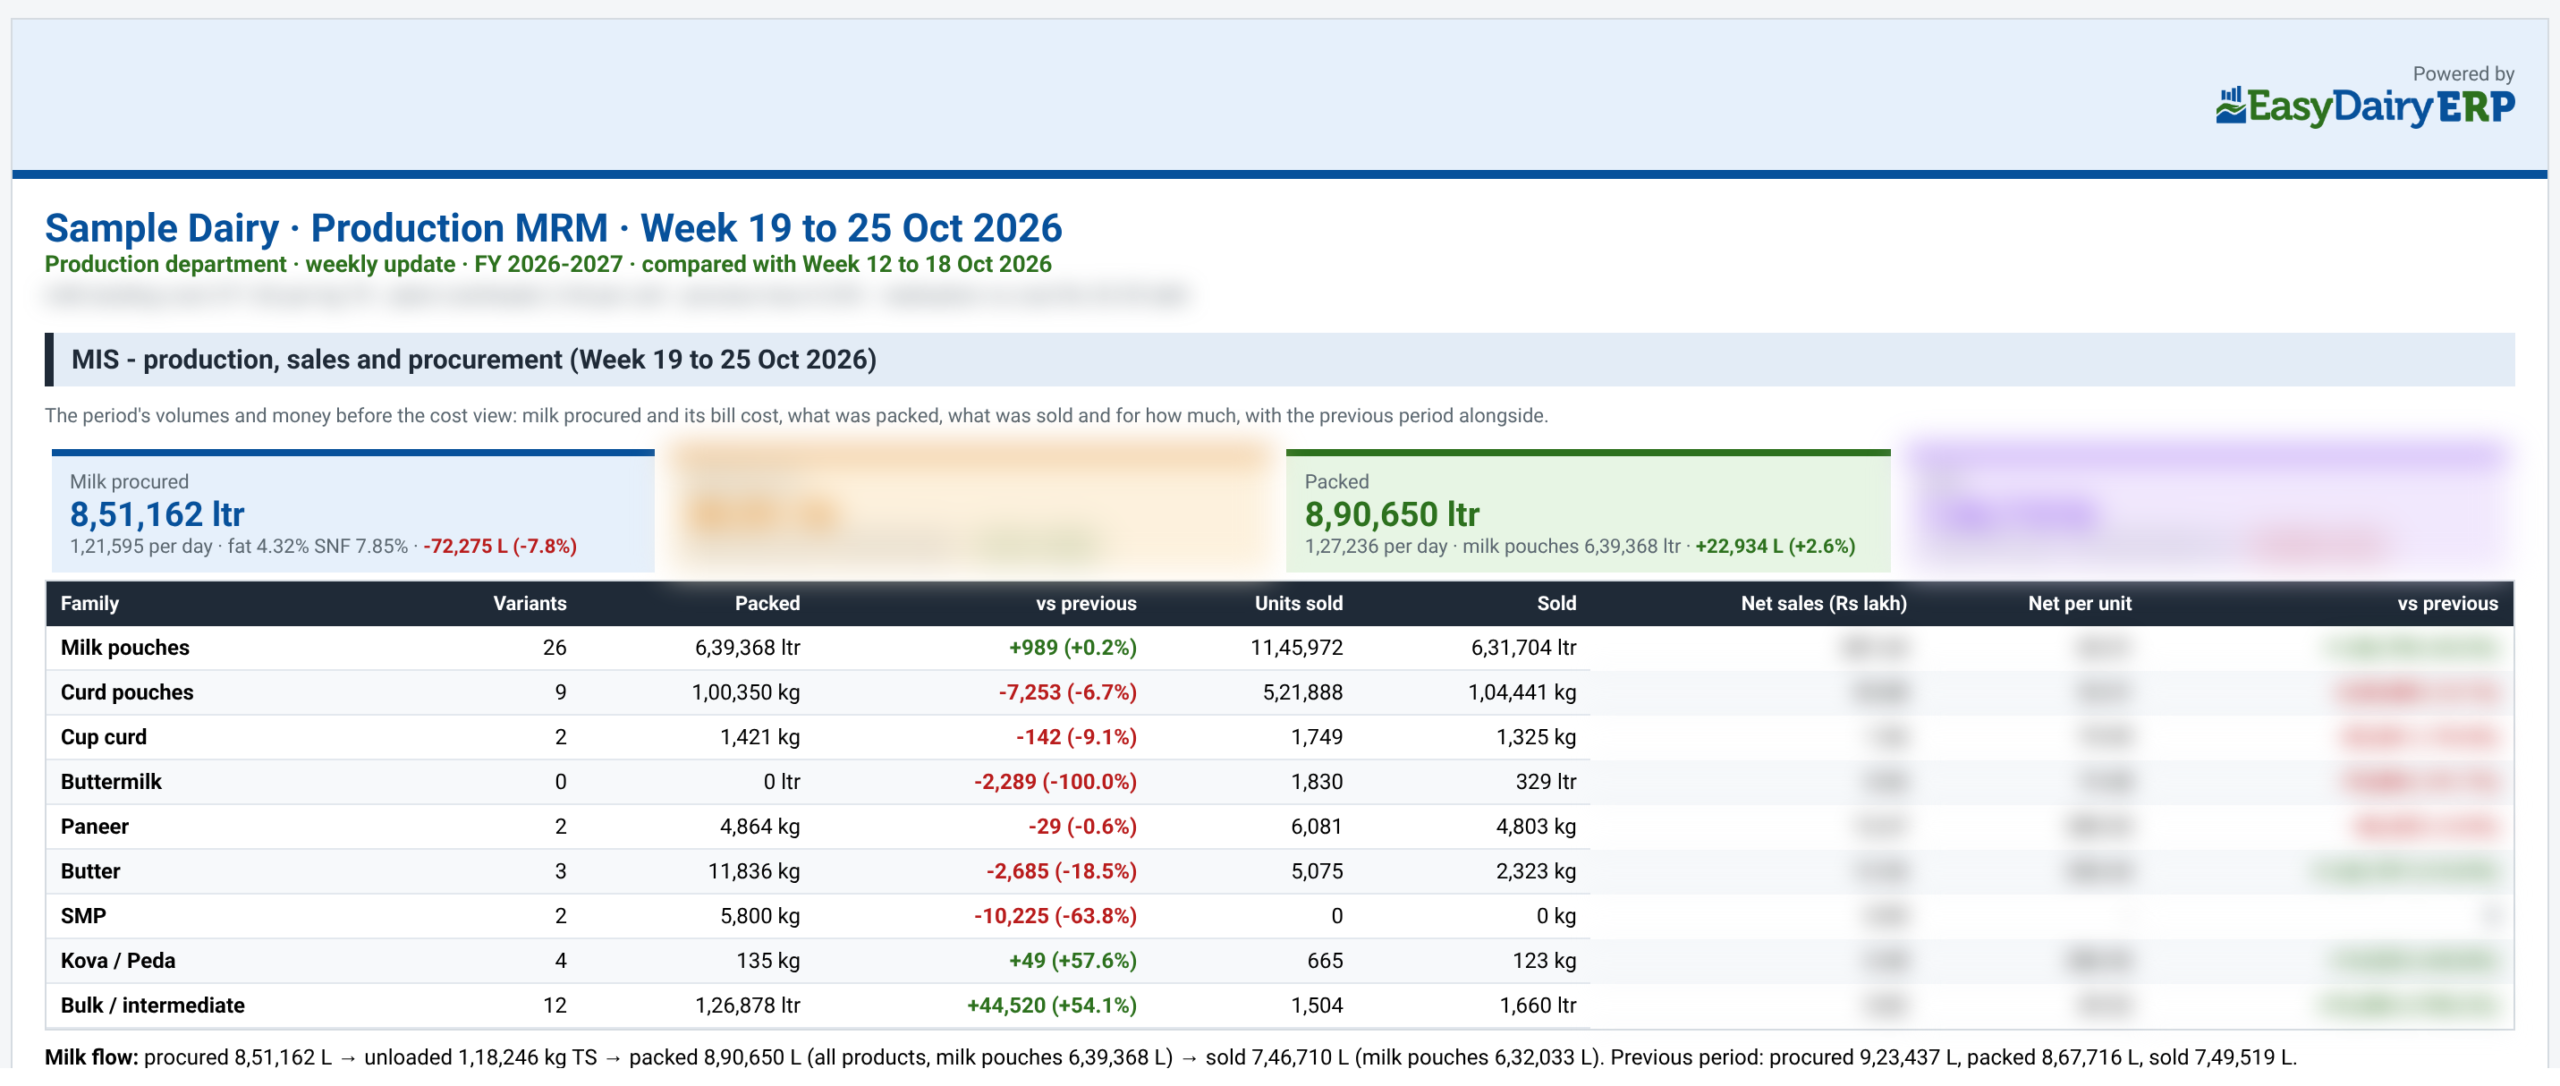
Screenshot 1: the top of the weekly review. Milk procured, packed and sold for each product family, against the previous week. Money columns are blurred.
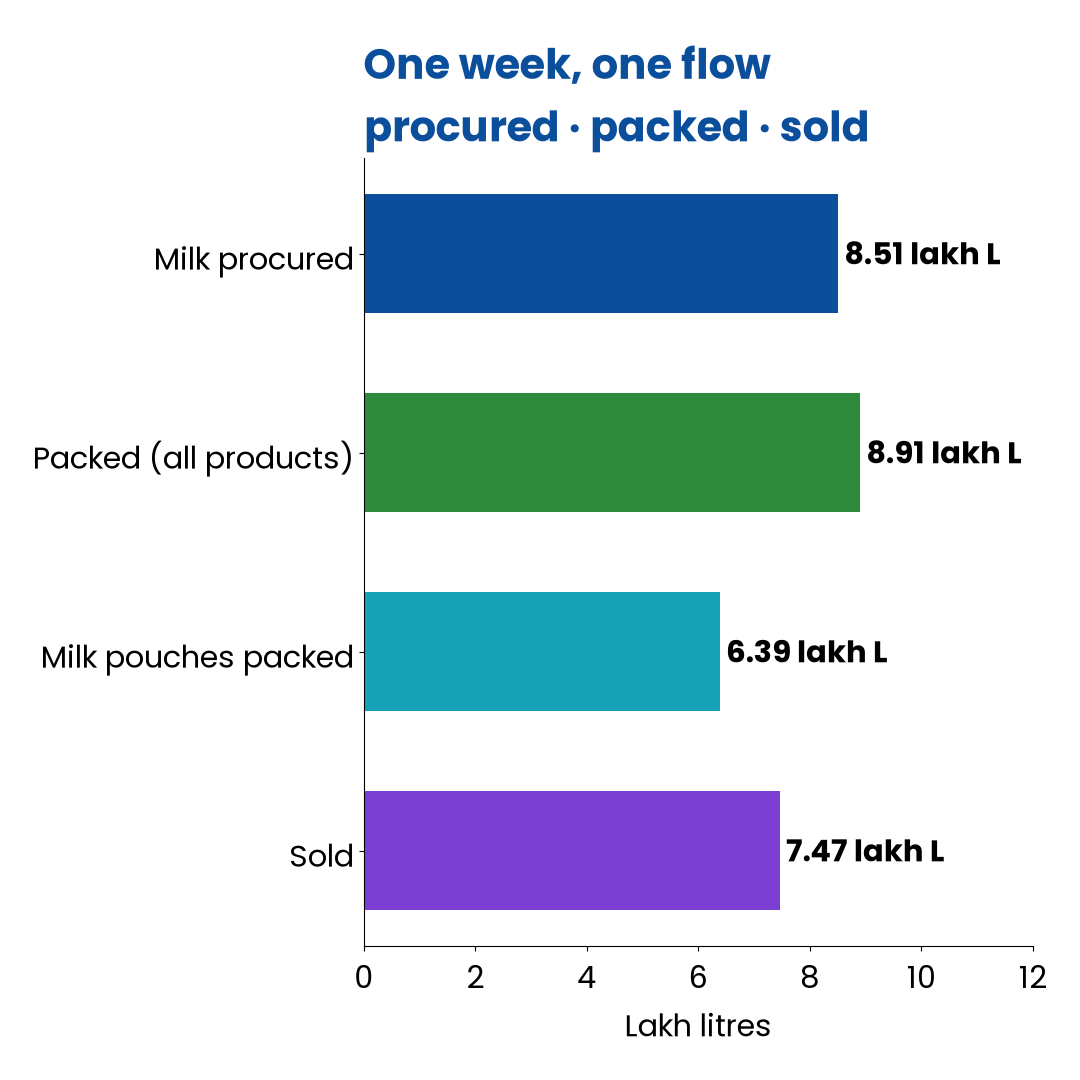
Chart: one week, one flow. Milk procured, packed (all products), milk pouches packed and sold, in lakh litres.
Inside the report
The sections of the review
MIS
Milk procured, packed and sold for each product family, with the previous week alongside.
Cost worksheet
Cost per SKU against realisation, with editable benchmarks. Shown here as a feature only.
Strategy implementation
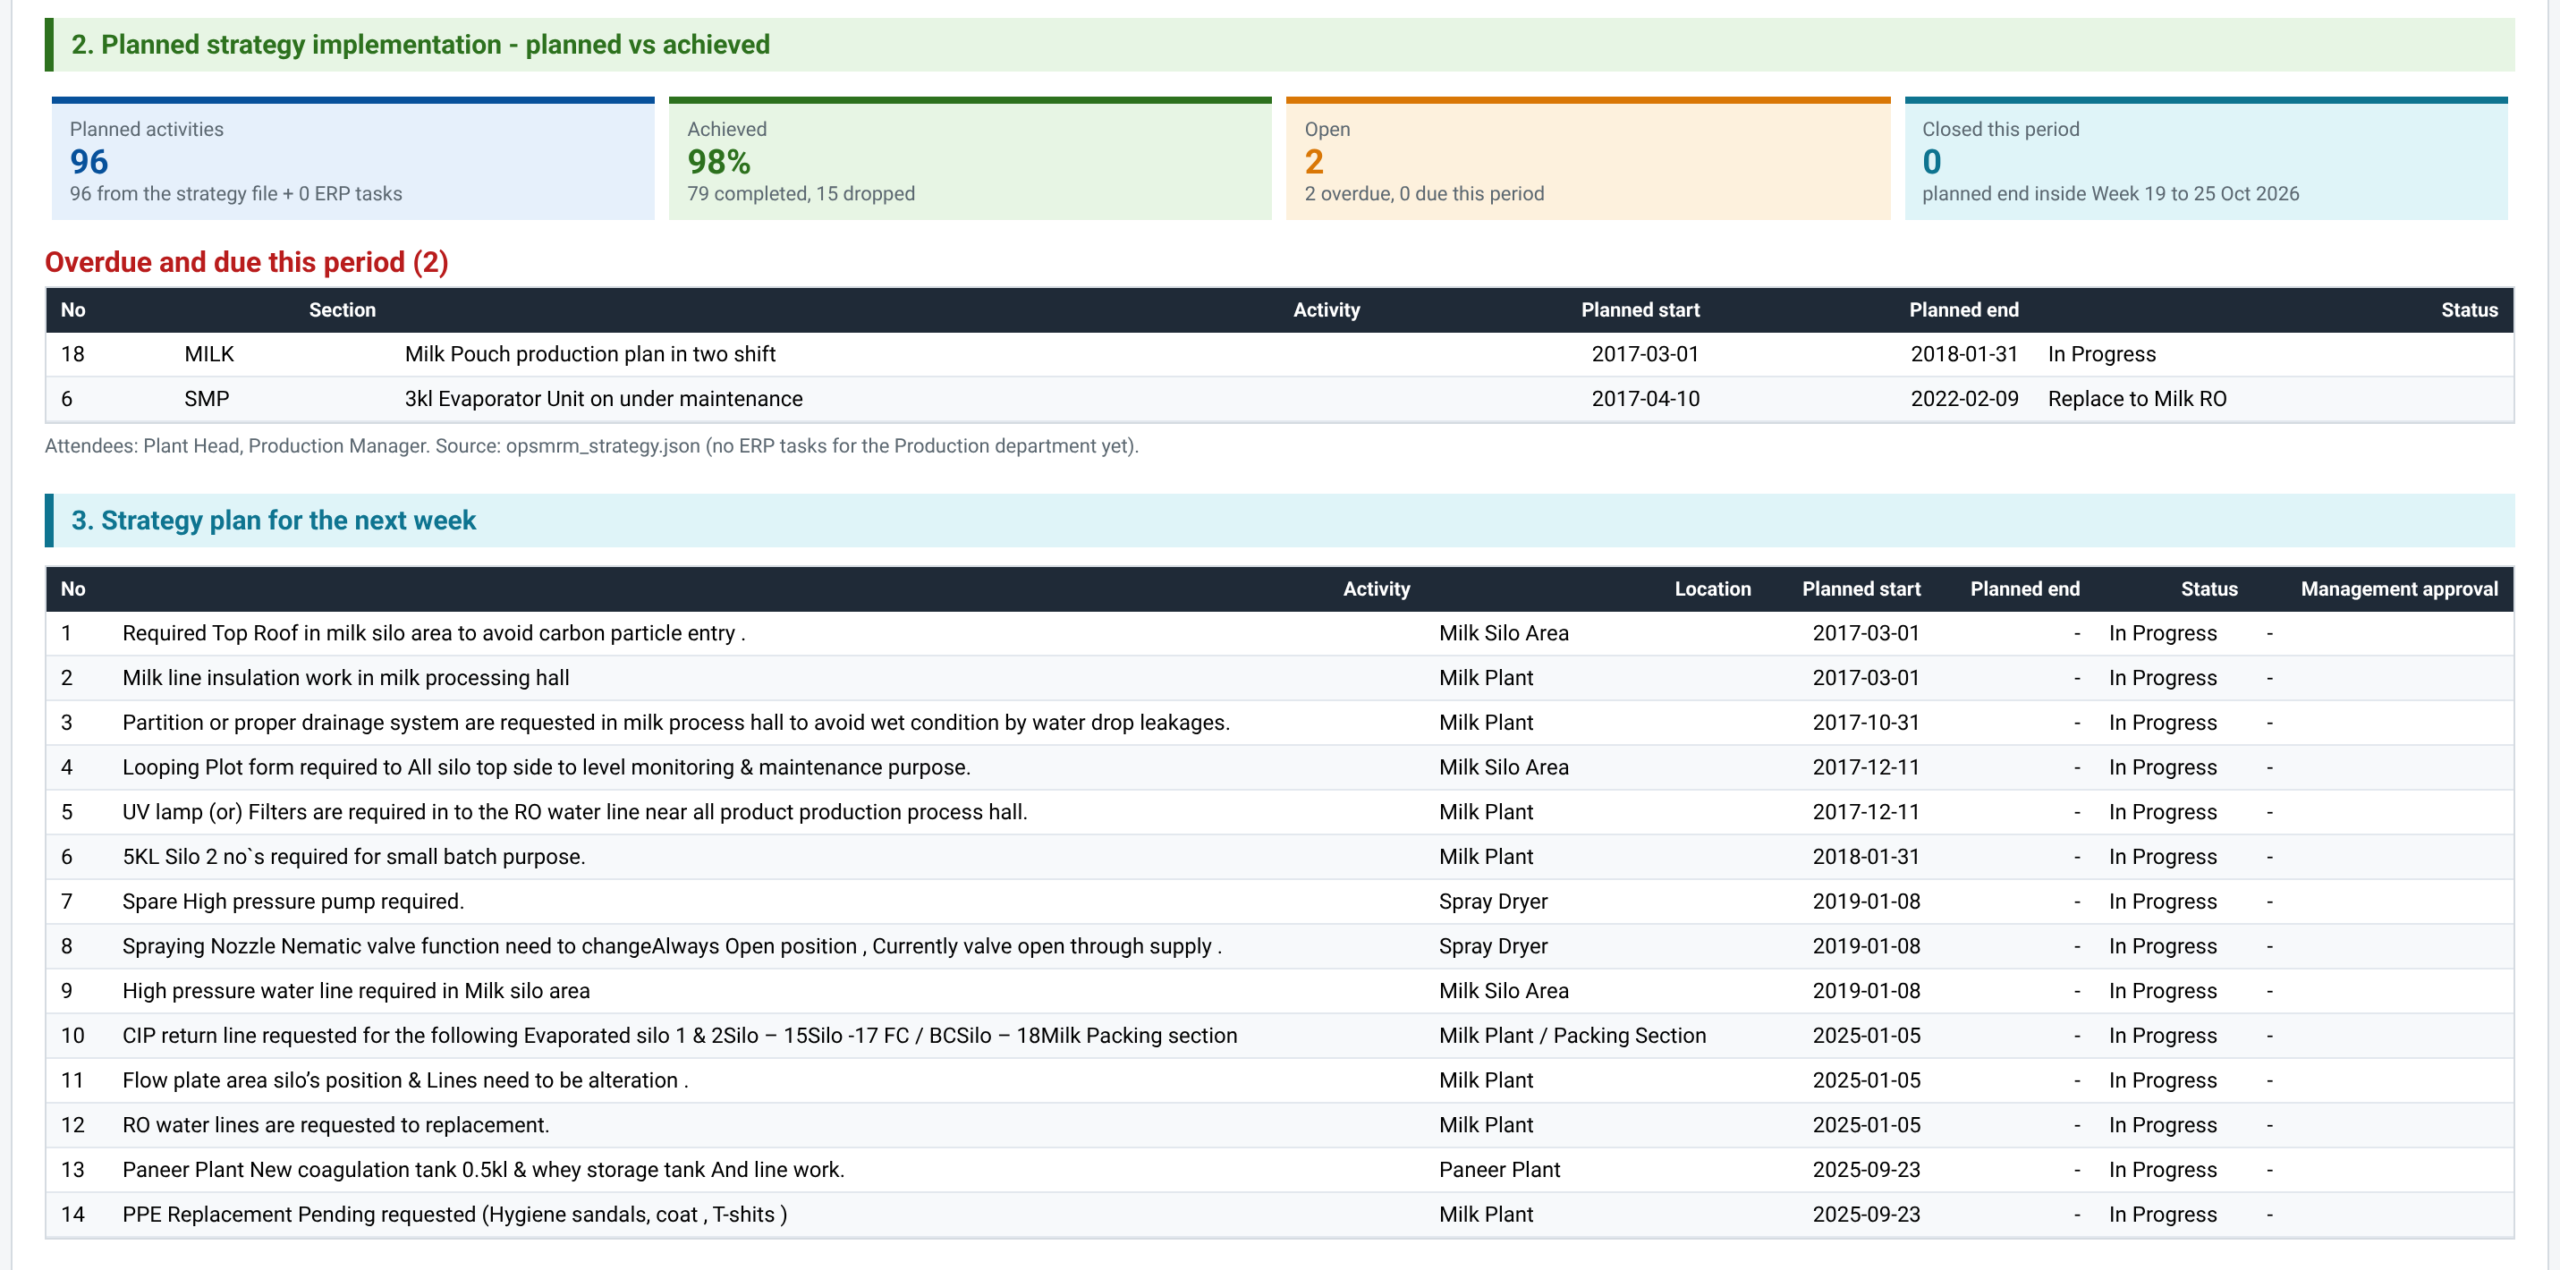
Planned activities against achieved, with overdue items called out by name.
Next-week plan
The activities planned for the coming week, with location, dates and status.
TS solids balance
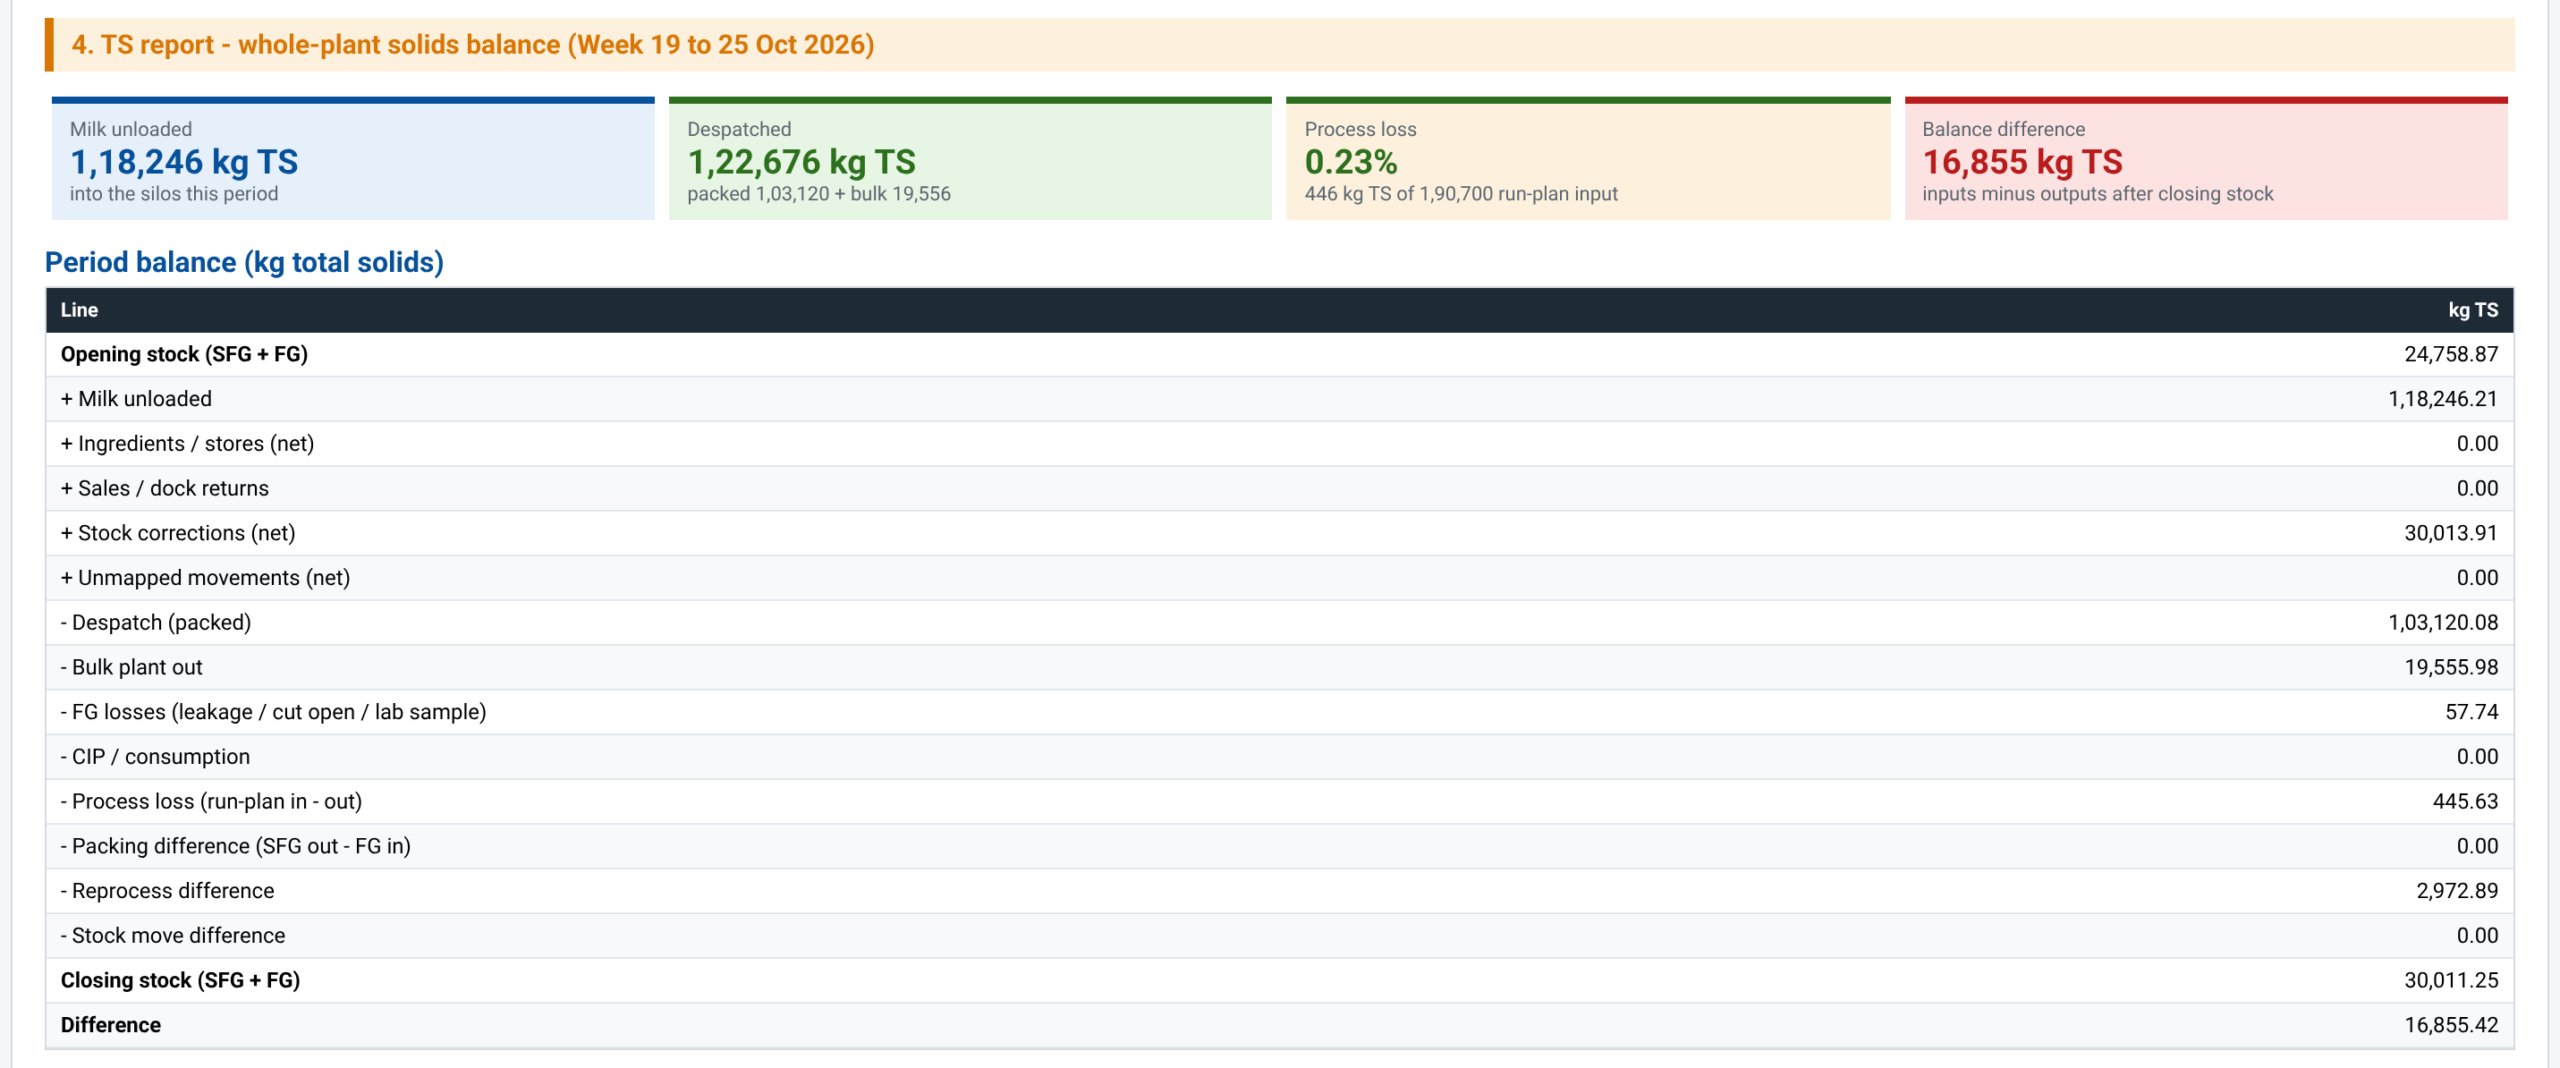
Whole-plant total-solids balance: milk unloaded, despatched, process loss and the difference.
Film (milk)
Pouches per kg of film for every roll, against the roll’s benchmark yield.
Film (curd)
The same roll-by-roll film check for curd pouches and cups.
Paneer
Milk used, paneer made, yield and moisture, run by run.
Pouch weight MIS
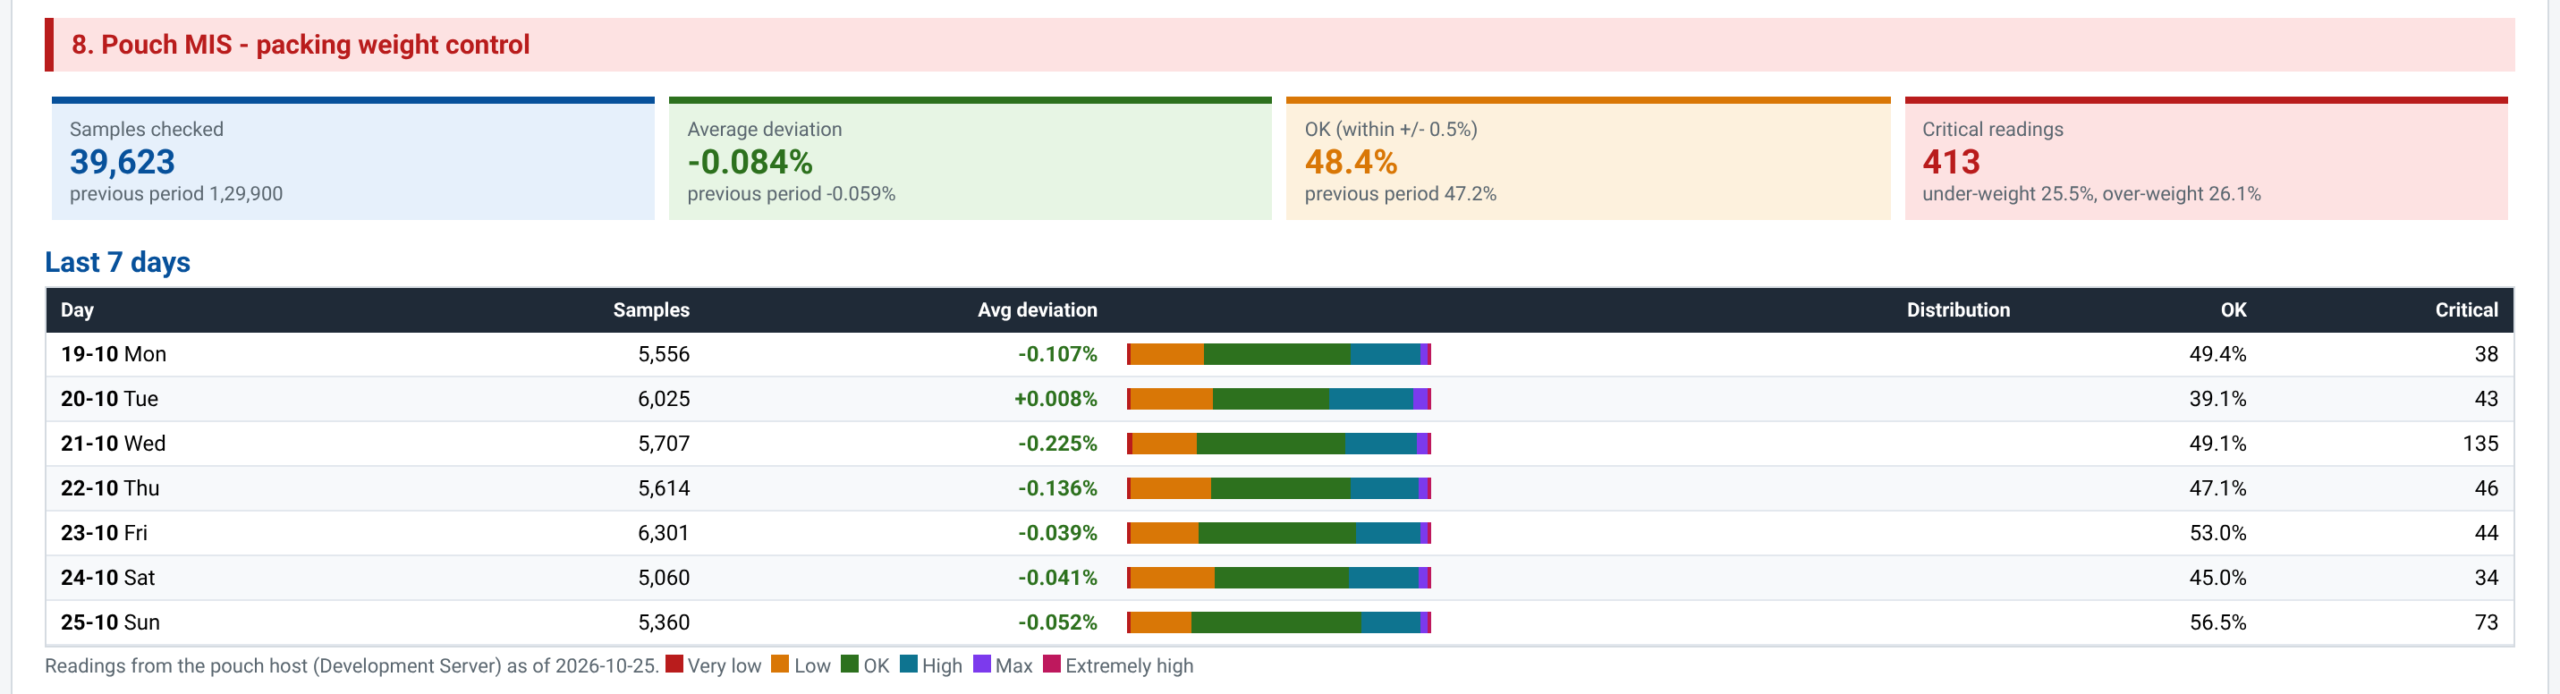
Samples checked, average deviation, share within ±0.5% and critical readings, day by day.
Worked example
Film, roll by roll
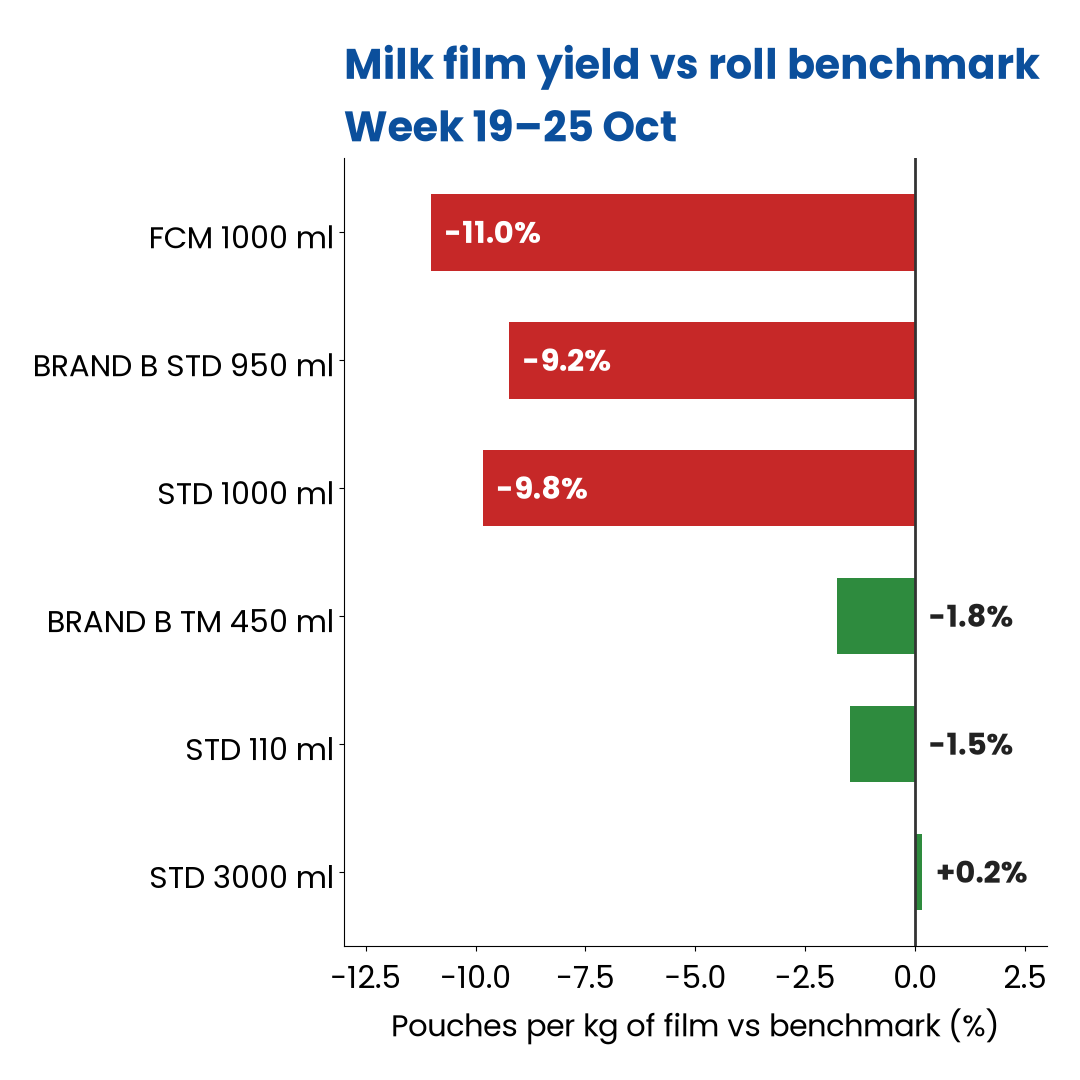
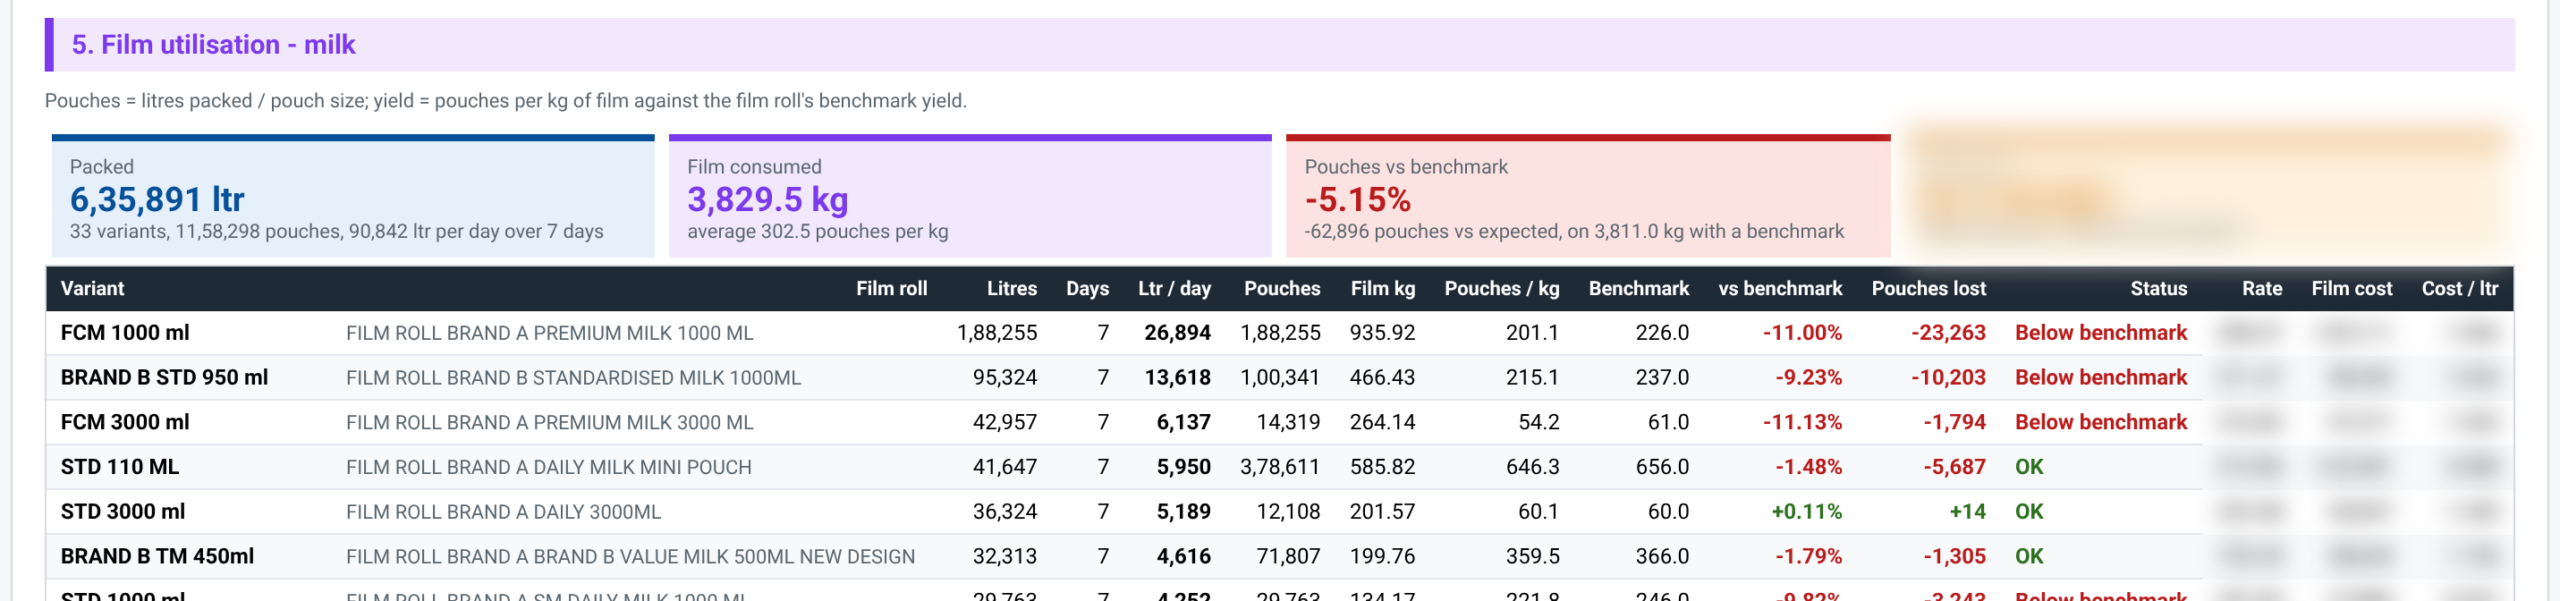
Last week the FCM 1000 ml roll gave 201.1 pouches per kg of film against a benchmark of 226.0. That is −11.0%, or 23,263 pouches fewer than the film should have made.
The report marks the roll “Below benchmark”, so it is the first thing on the agenda.
Chart: milk film yield against each roll’s benchmark, week 19–25 October.
Screenshot 2: film utilisation for milk. Litres, pouches, film kg, pouches per kg, benchmark and pouches lost for every variant. Film brands are replaced with “Brand A/B” and cost columns are blurred.
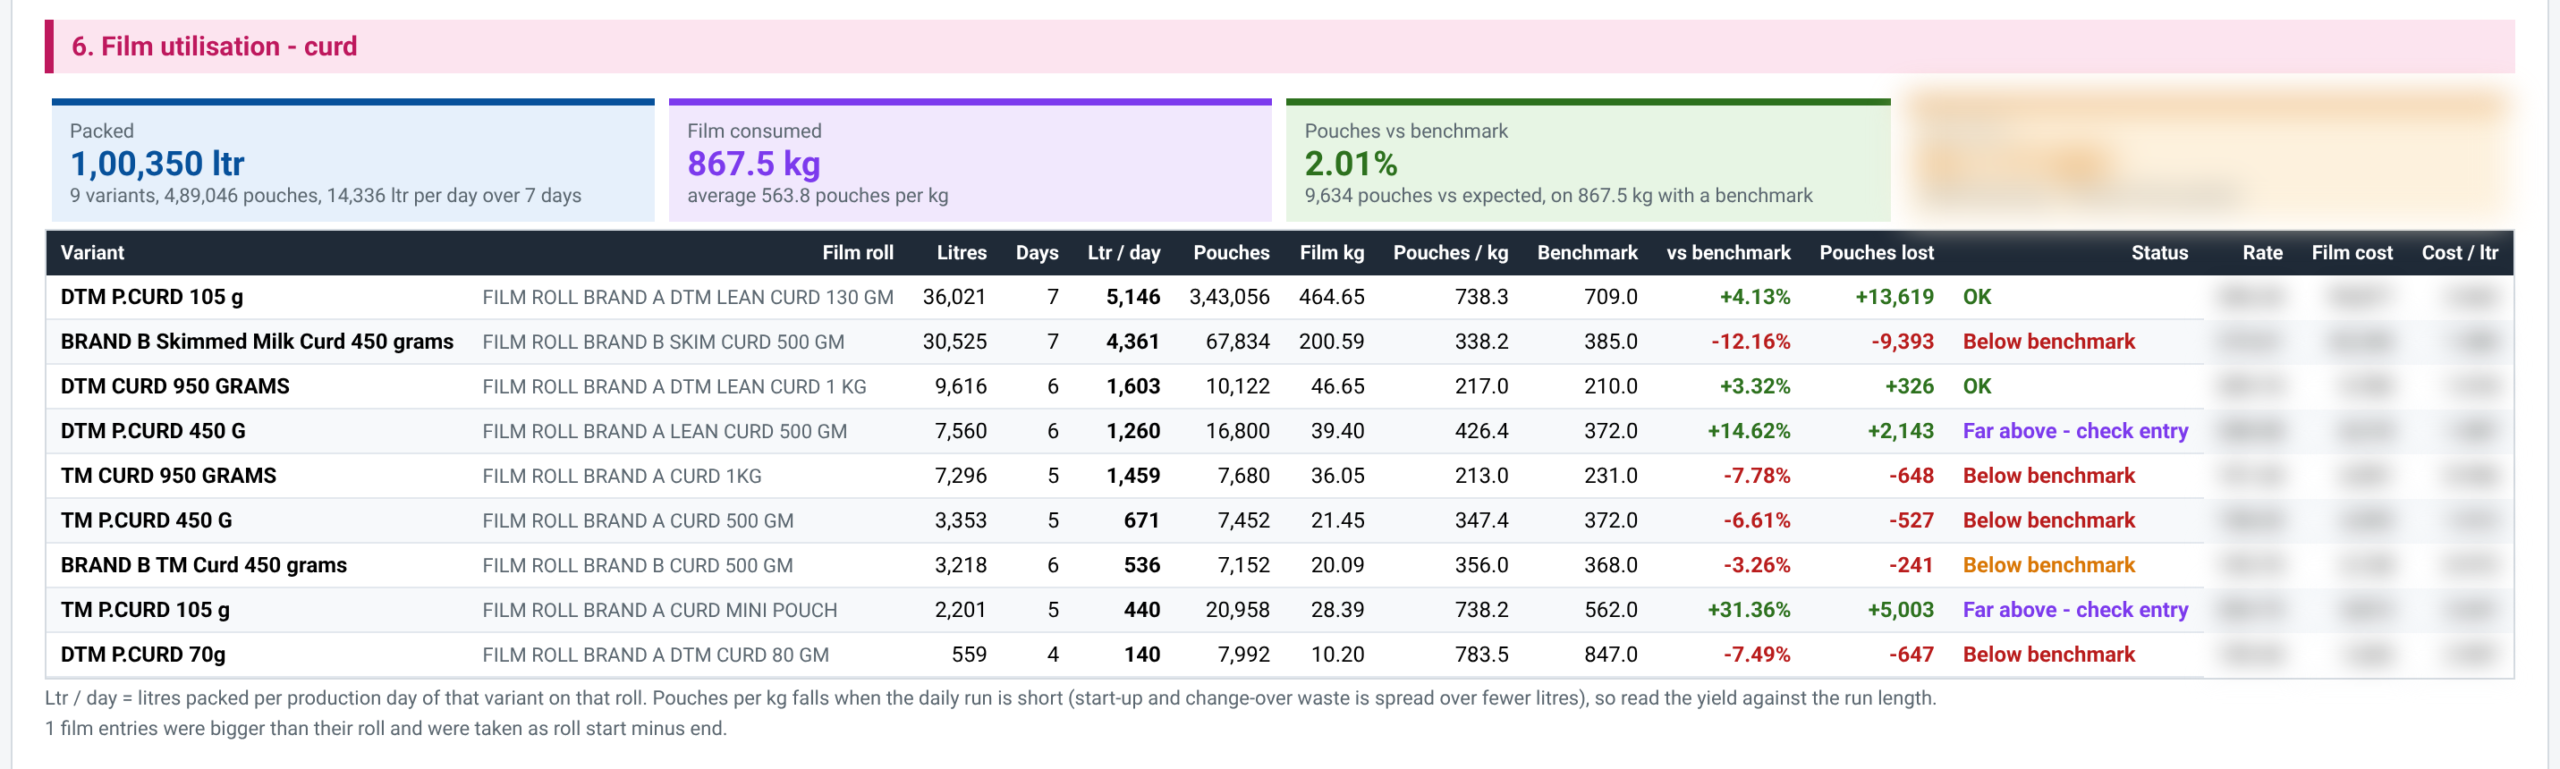
Screenshot 3: the same check for curd film.
Worked example
Paneer, run by run
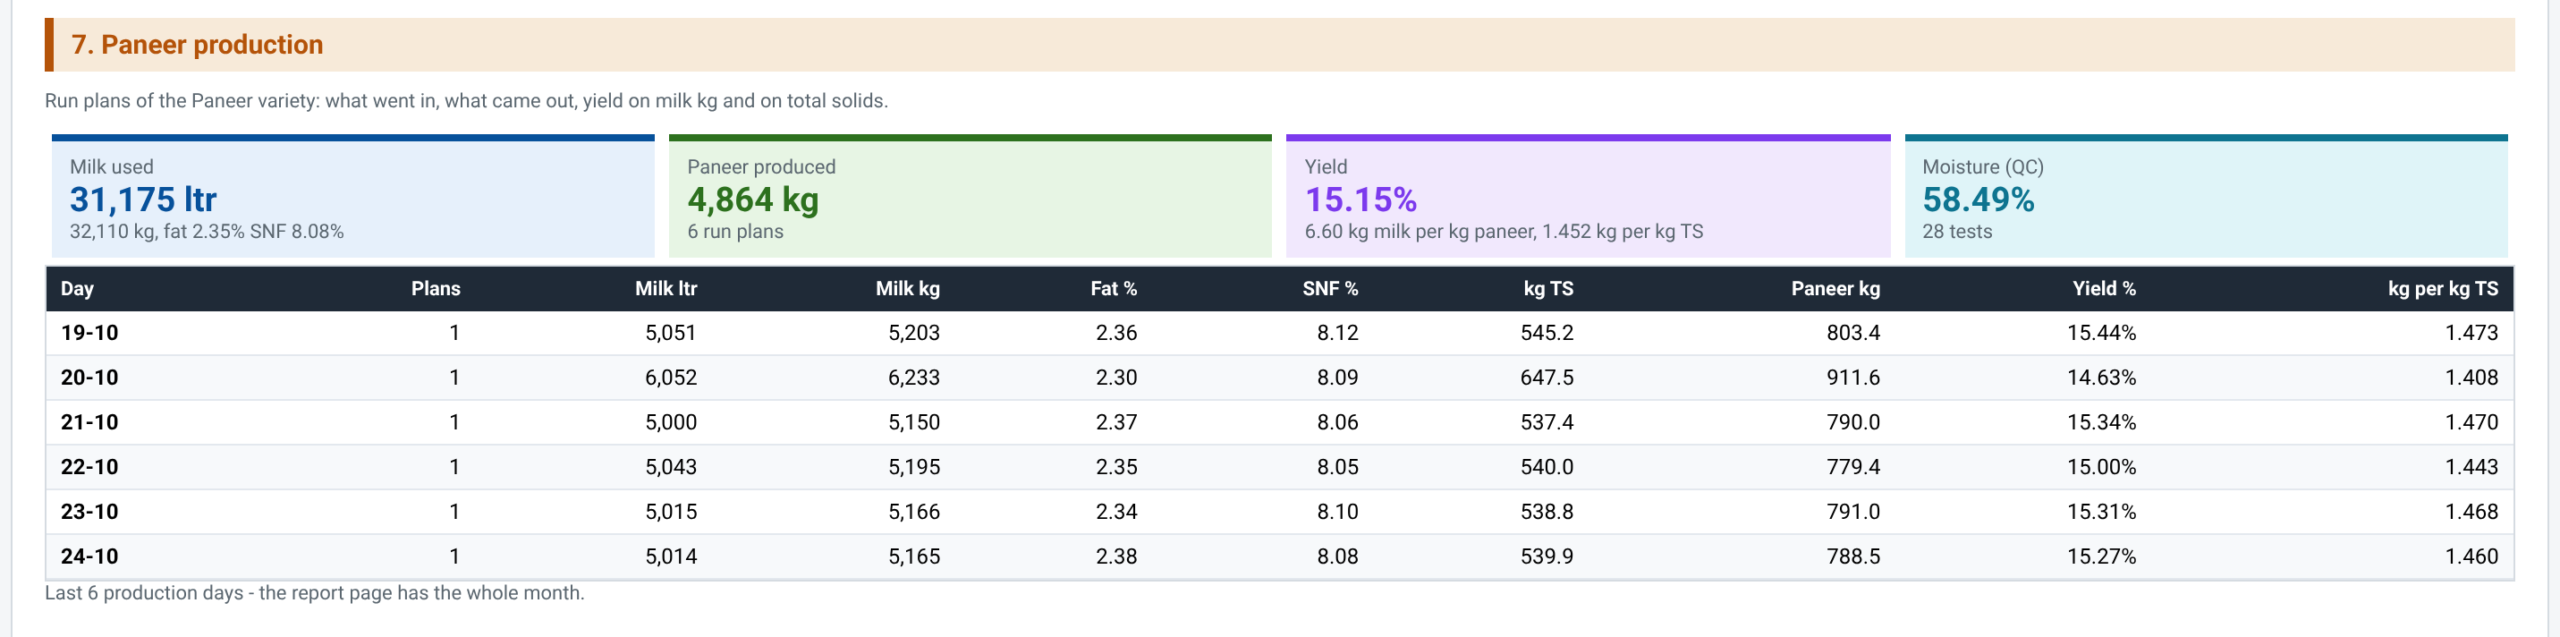
From 31,175 L of milk the plant made 4,864 kg of paneer: a 15.15% yield, or 6.60 kg of milk per kg, at 58.49% moisture across 28 QC tests.
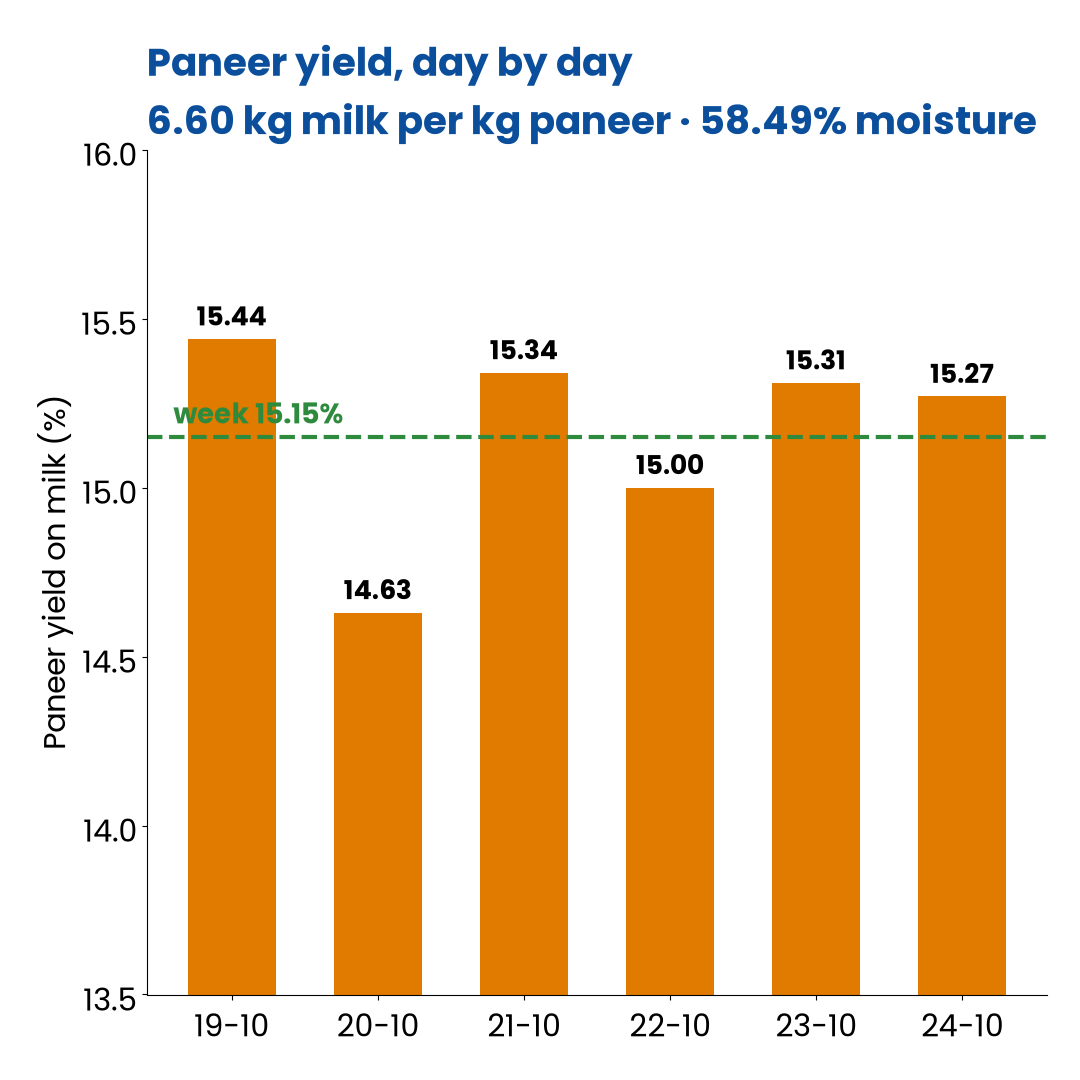
Each day shows milk used, fat and SNF, total solids, paneer made, yield and kg per kg TS, so a weak day stands out at once.
Chart: paneer yield on milk, day by day, against the week’s 15.15%.
Screenshot 4: paneer production. Run plans, milk in, fat, SNF, TS, paneer out and yield for each day.
Worked example
Pouch weights, day by day
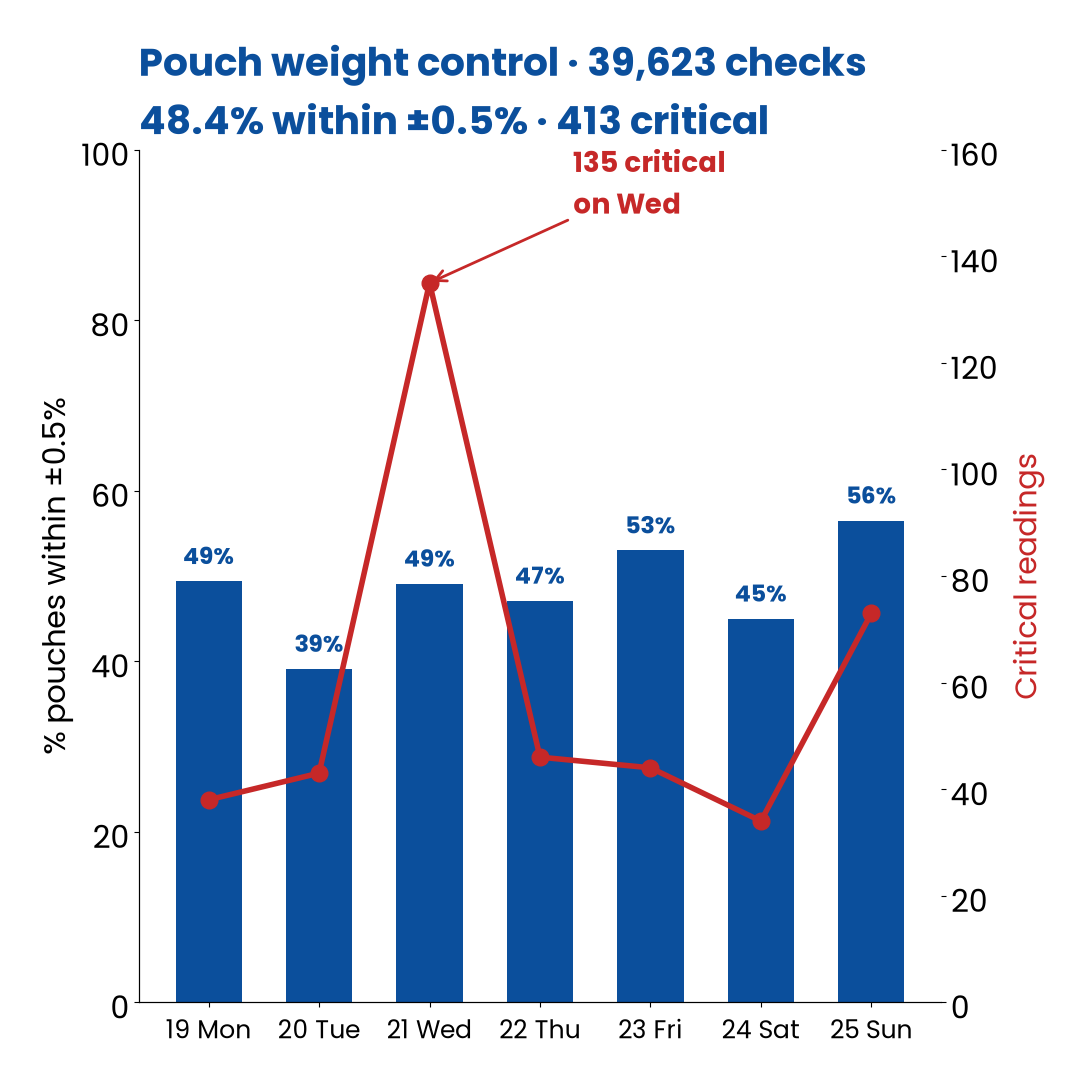
There were 39,623 checks and 48.4% were within ±0.5%. 413 readings were critical, and 135 of those came on Wednesday.
The readings come straight from the pouch checker. The report shows the spread for each day.
Chart: share of pouches within ±0.5% and critical readings, day by day.
Screenshot 5: pouch weight control. Samples, average deviation, share within ±0.5% and critical readings for each day.
Solids balance
The whole-plant TS balance
The report balances total solids across the plant: milk unloaded, despatched, process loss and the difference. The balance difference is shown so it can be explained.
Screenshot 6: the TS report, with the whole-plant solids balance in kg of total solids.
Action list
The action list, kept honest
The review tracks 96 planned activities. Overdue items are listed by name (2 last week), and next week’s 14-item plan follows with location, dates and status.
Screenshot 7: planned strategy implementation, planned against achieved, the overdue items and the plan for next week.
Cost sheet
The interactive cost sheet
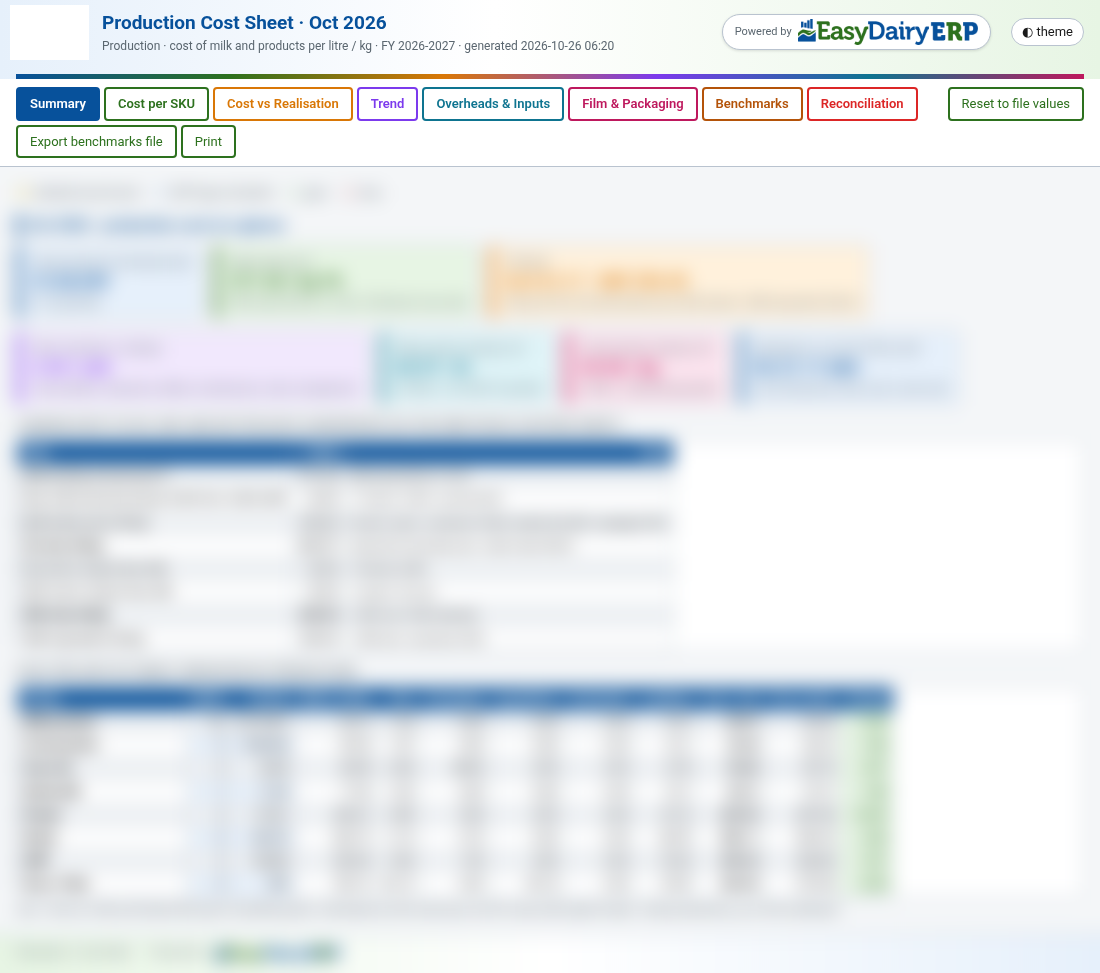
The third tab is a cost sheet you can work with: editable benchmarks, cost per SKU, cost against realisation, trend, overheads and inputs, film and packaging, and reconciliation tabs.
Screenshot 8: the production cost sheet tabs. All values are blurred on this page.
Where the data comes from
Nothing is typed into a spreadsheet
Every number in the review comes from entries already made in EasyDairyERP during the week:
Procurement: centre and bulk-vendor milk bills
Packing entries for every product
Sales lines by business date
The film store and film issues
Run plans for paneer and other products
QC tests
The pouch checker
Video
The weekly review in two minutes
What arrives at 06:20 on Monday: MIS, film, paneer, pouch weights and the action list (English, about 2 minutes)