
Sales Screens
The sales screens and reports in one place: live dashboards, comparisons, customer transactions, variant trends, GST, incentives, ledgers, credit flow and pouch costing.
A gallery of the main sales screens, each explained. Click any picture to see it full size.
DashboardsDashboards and comparisons
The screens the sales head opens first.
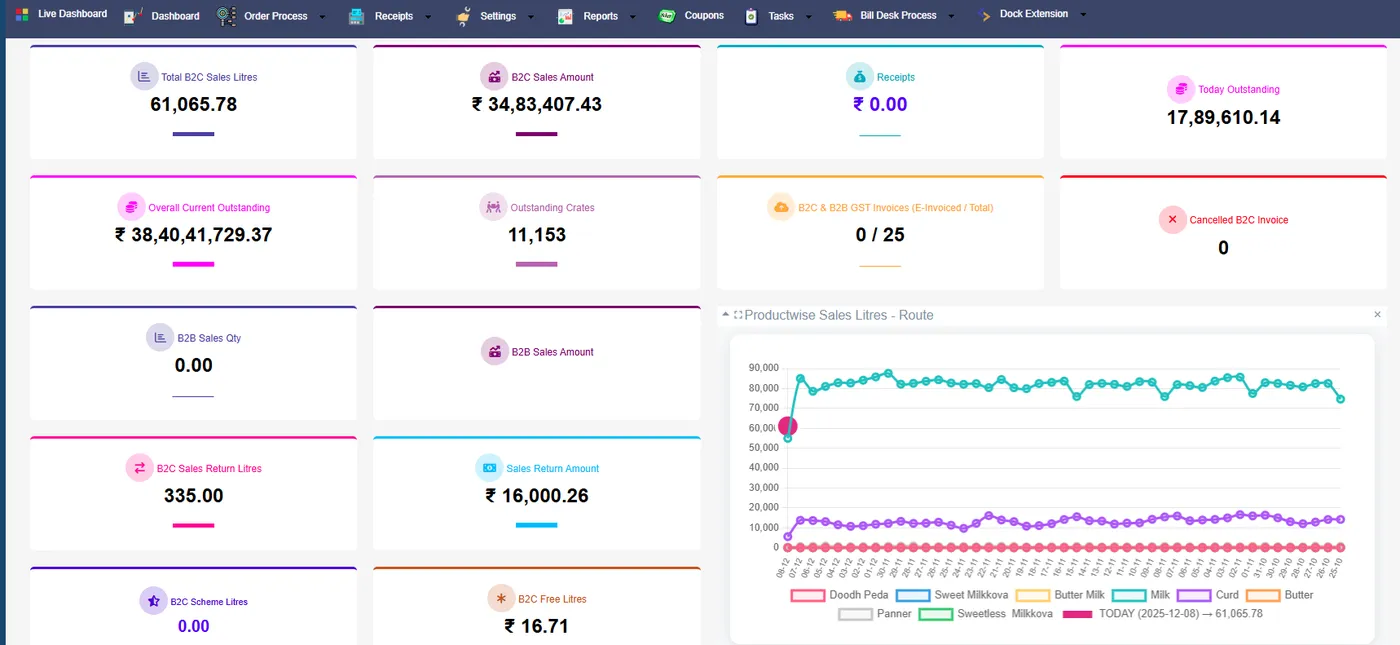
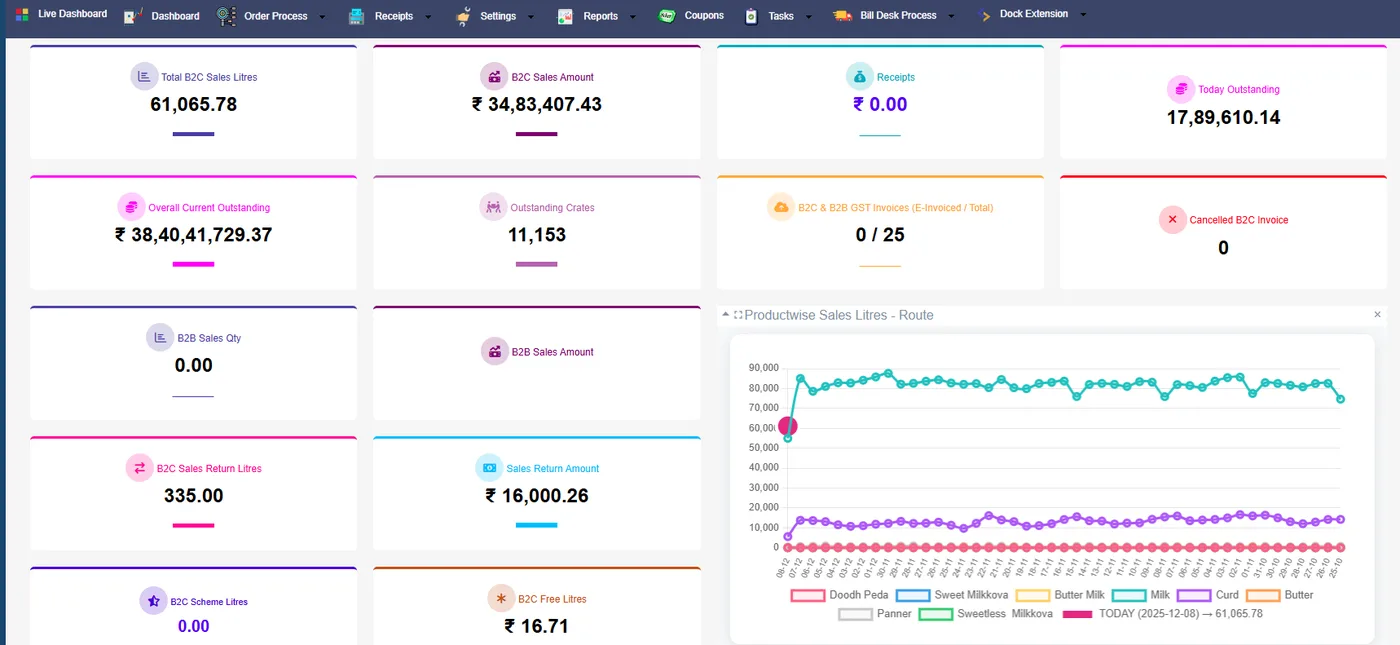
Live dashboard
Today’s sales as they are billed, by product group.
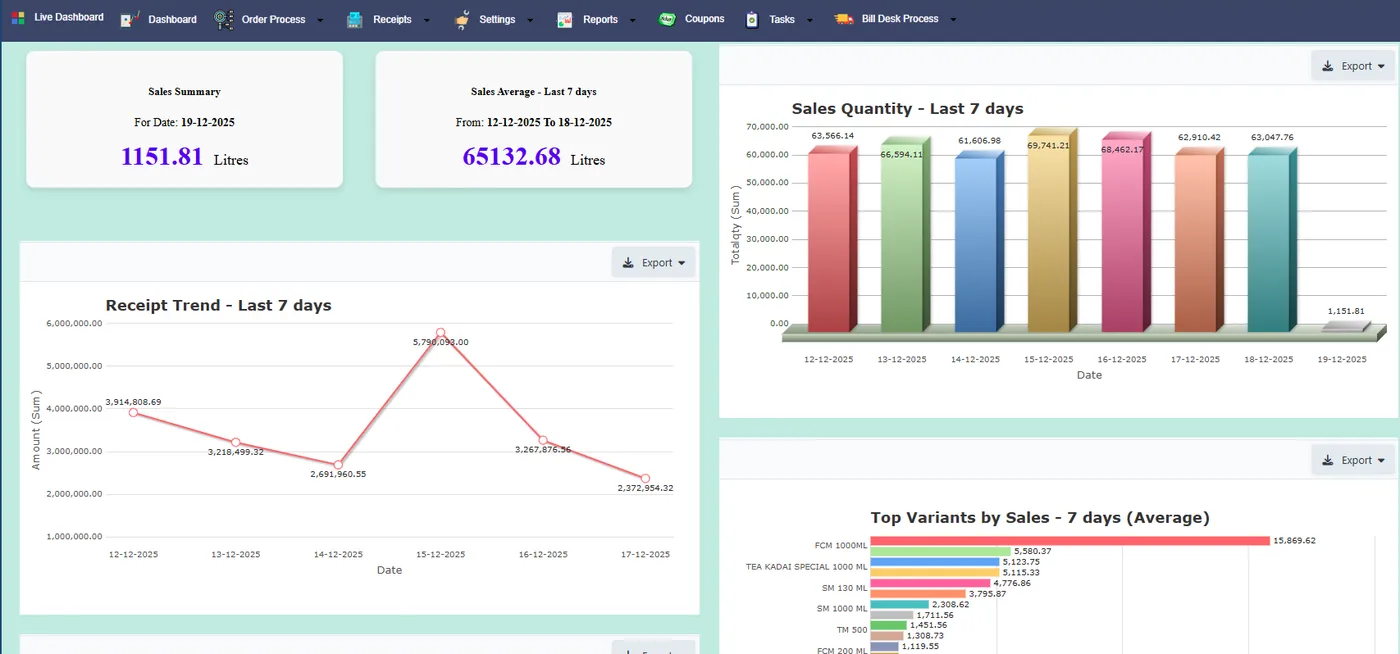
7-day trend
Each day of the last week side by side.
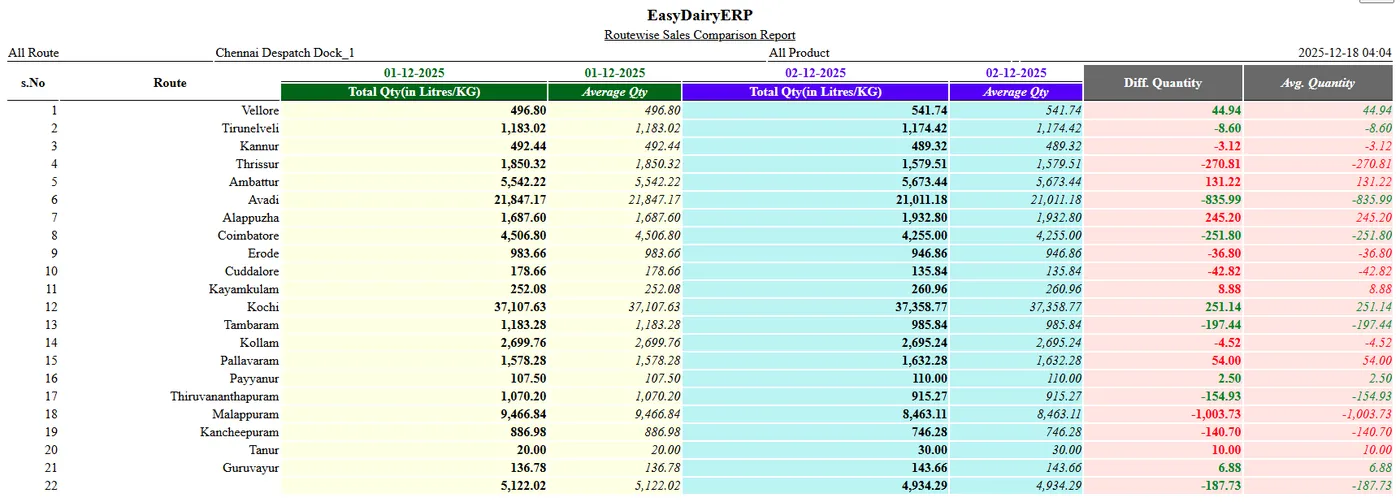
Route-wise comparison
Routes compared across dates.
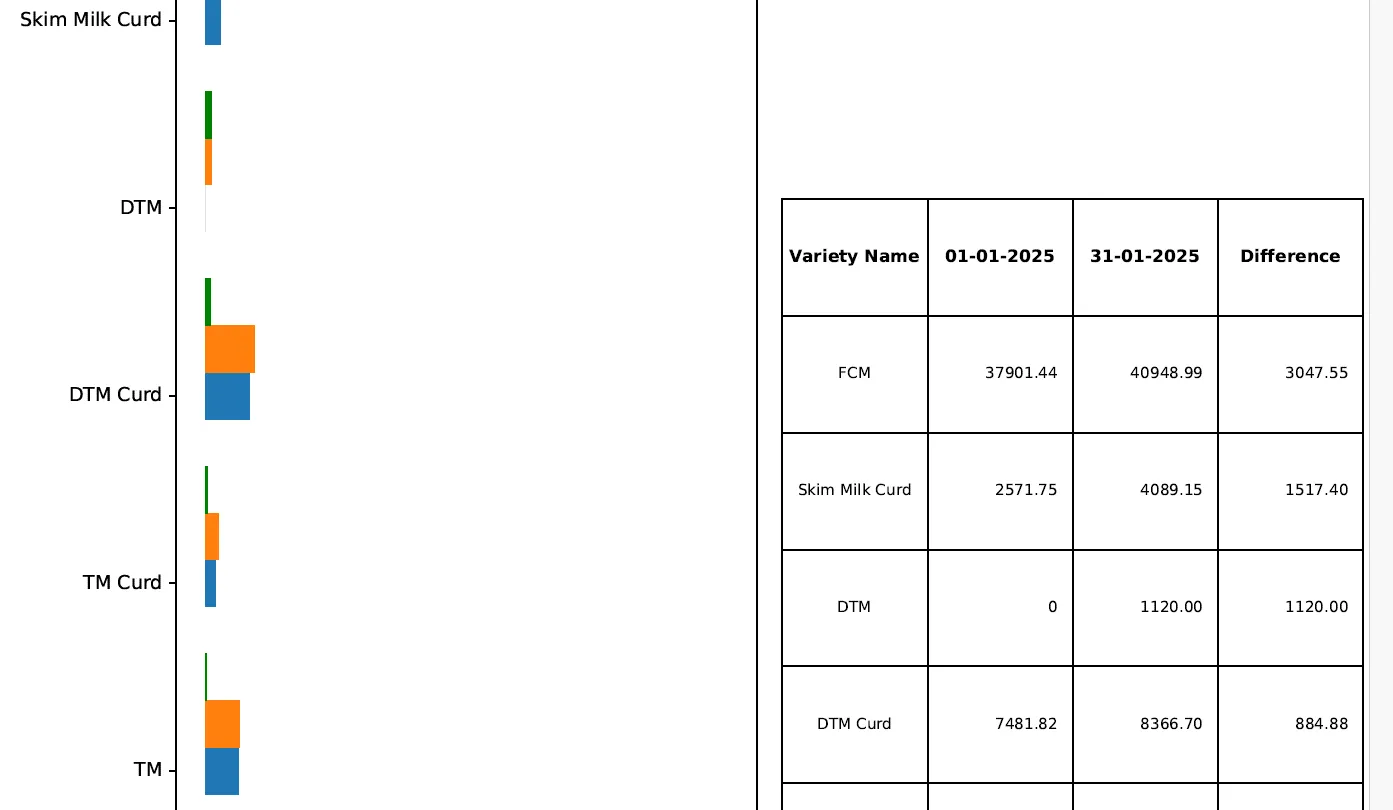
Trend change by SKU
SKU-level growth and decline.
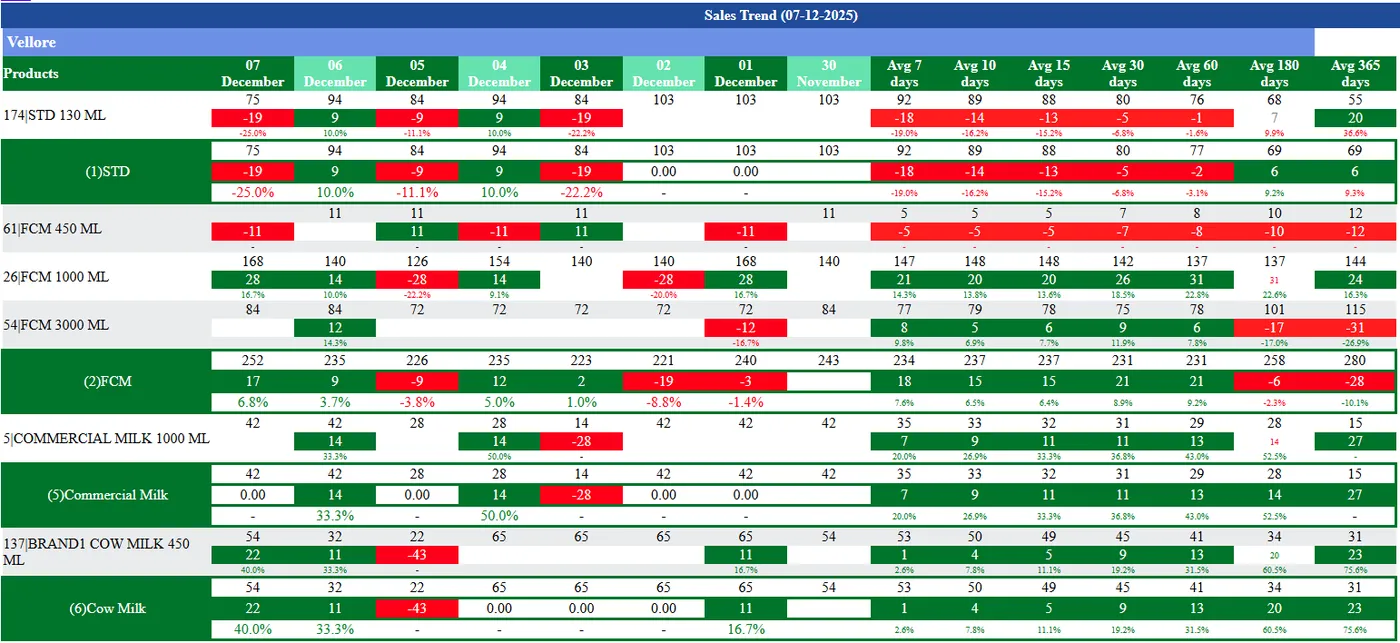
Variant-wise trend by route
One route, every variant.
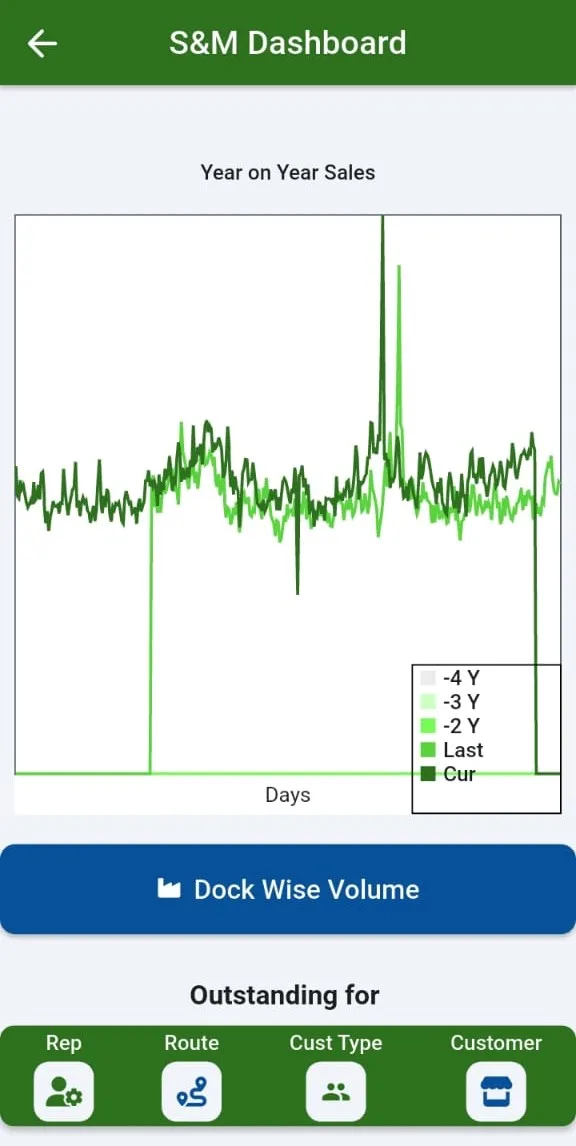
Year-on-year dashboard
This year against last.
Billing and moneyGST, schemes, ledgers and costing
The screens accounts and the sales office use every day.
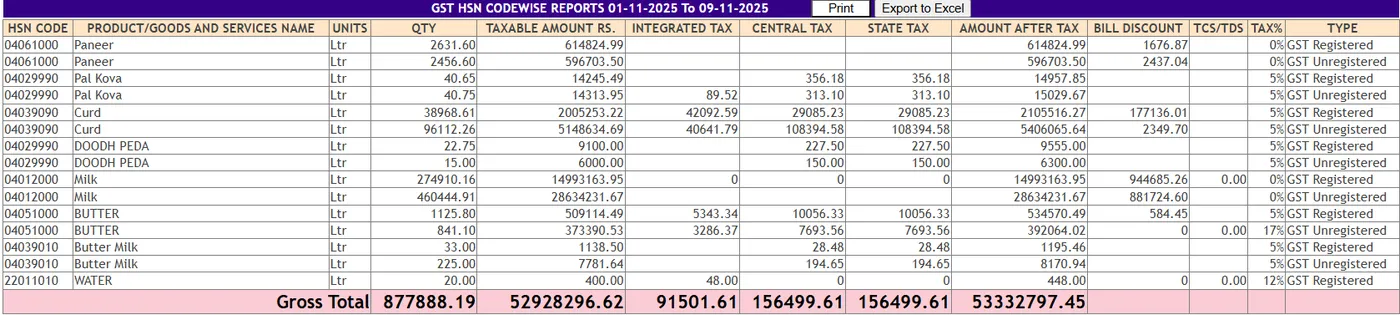
GSTR-1 HSN summary
HSN-wise and customer-wise GST for filing.
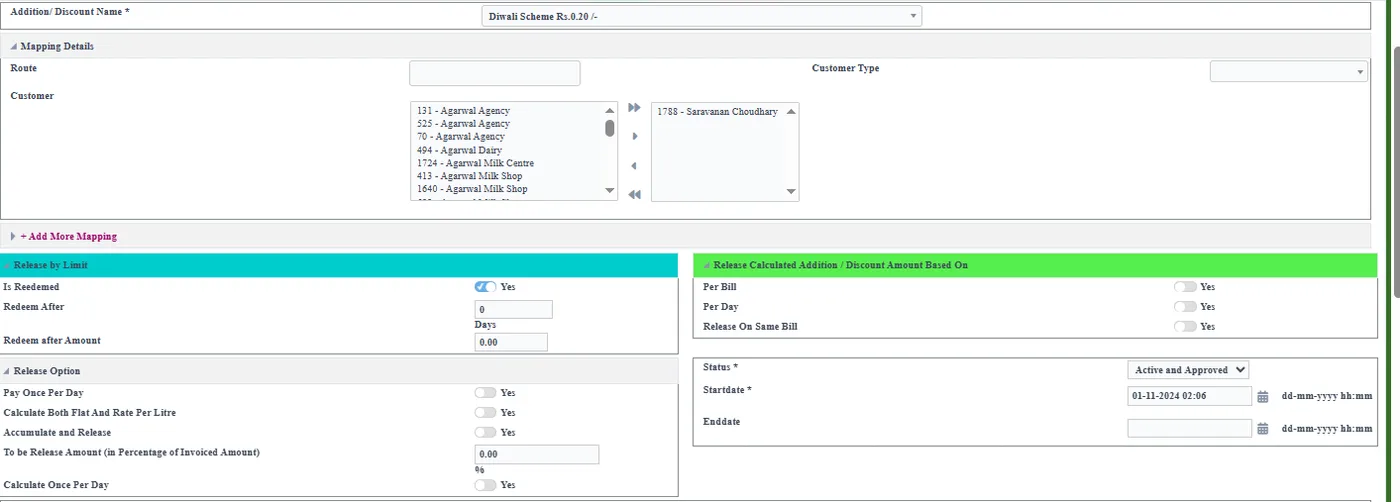
Trade discount scheme
Scheme set-up and the customers it applies to.
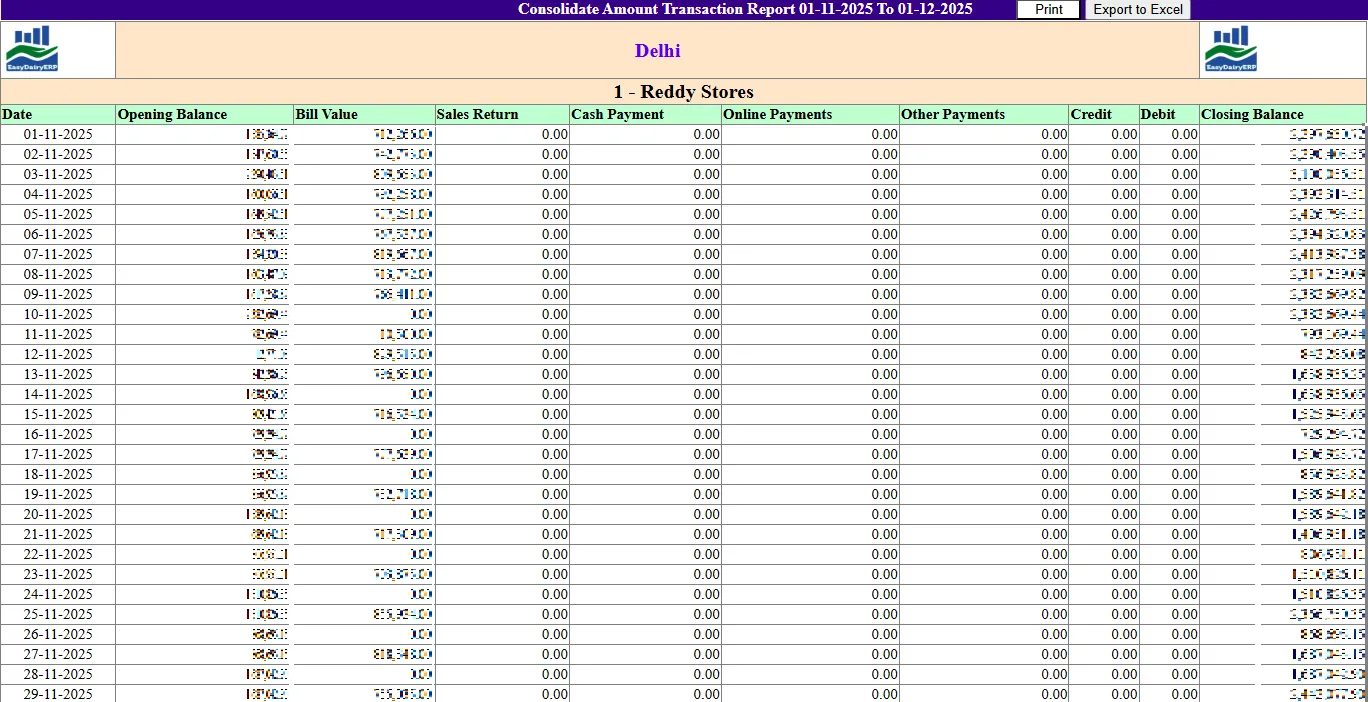
Customer consolidated transactions
Every transaction of a customer in one view.
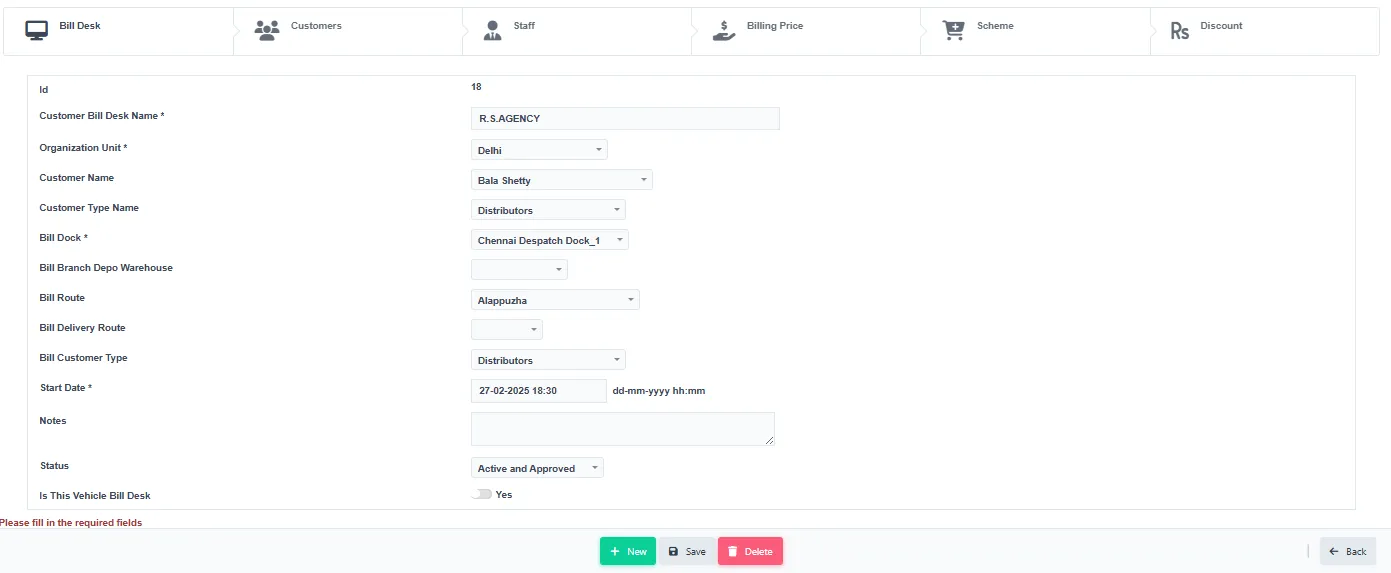
Customer bill desk master
Bill desk settings per customer.
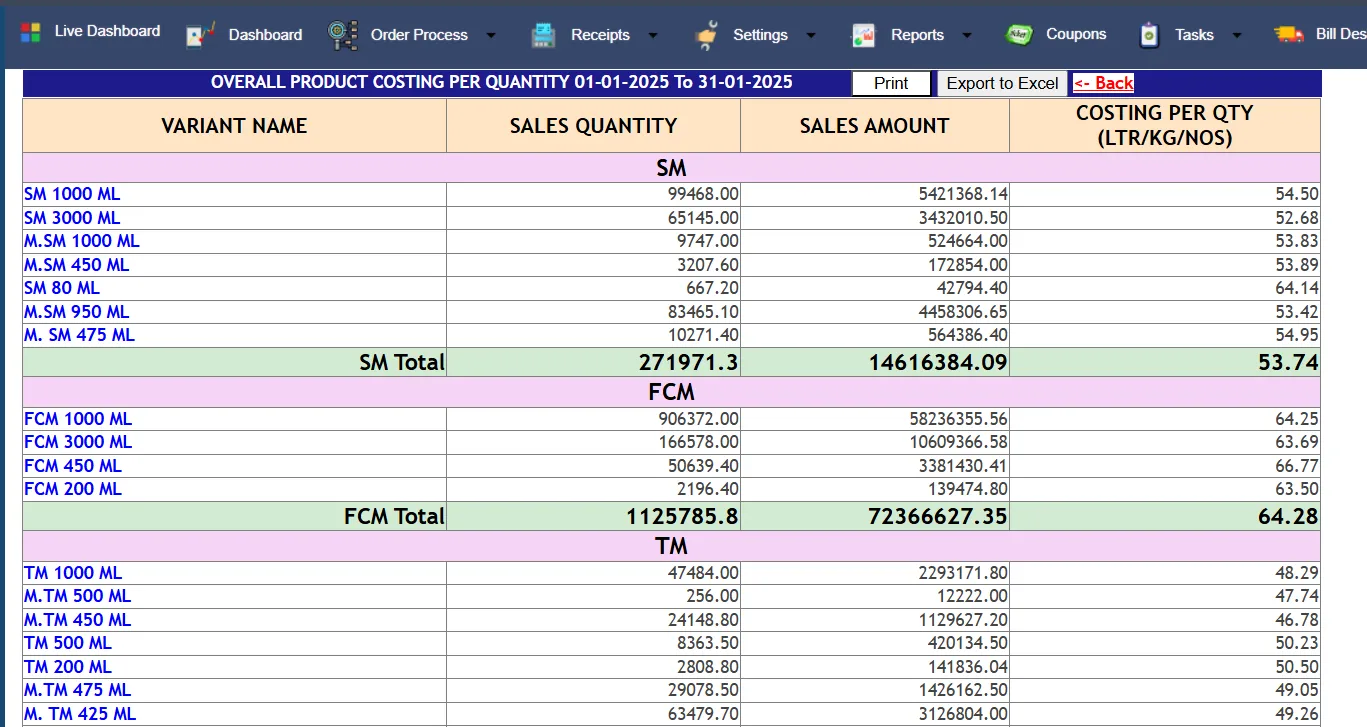
SKU costing per quantity
Cost per SKU and quantity.
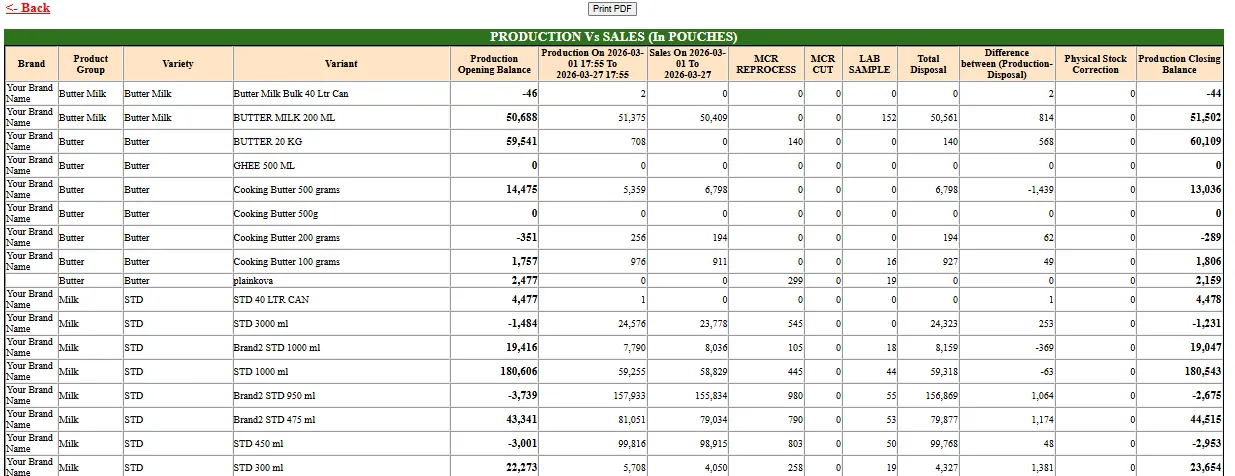
Production vs sales pouch stock
Pouches produced against pouches sold.
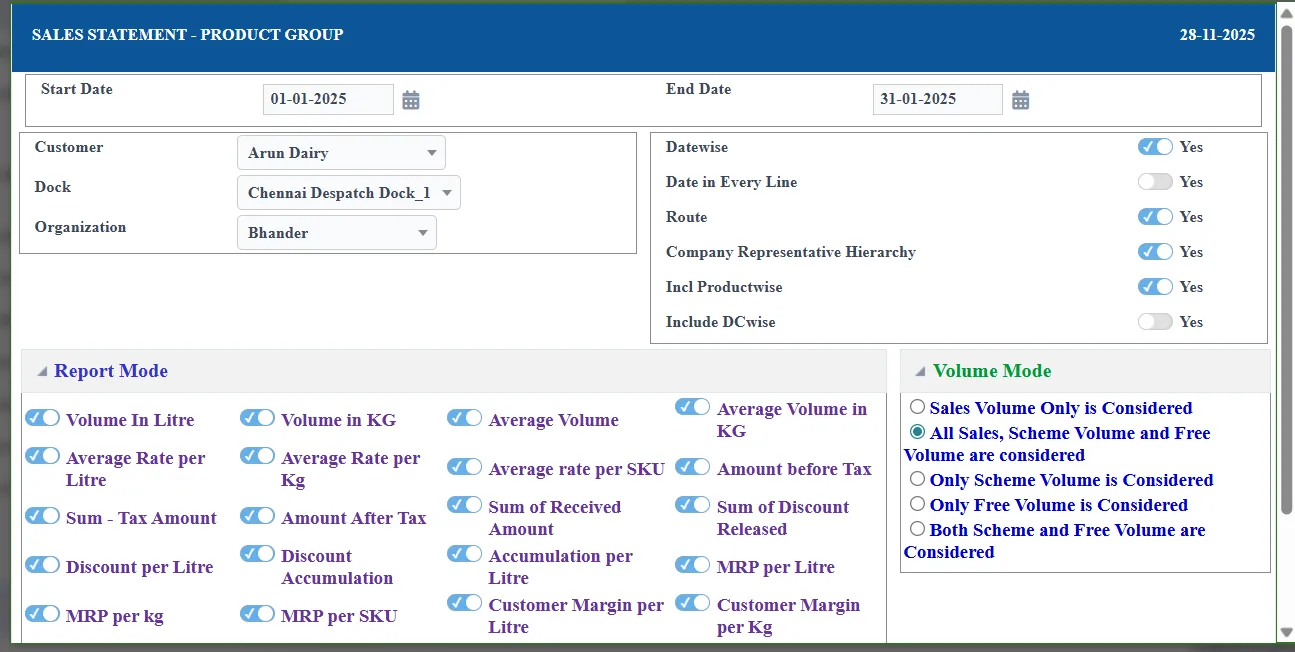
BI statement filter
Statements filtered by date, route and customer type.
Keep exploring at your own pace
Every module page walks through the screens, reports and mobile apps in the same way, so you can see exactly how EasyDairyERP fits your dairy.
When you have seen enough, we are happy to show it to you live on our sample data: book a demo or call +91 94880 59495.