
Financial P/L Daily
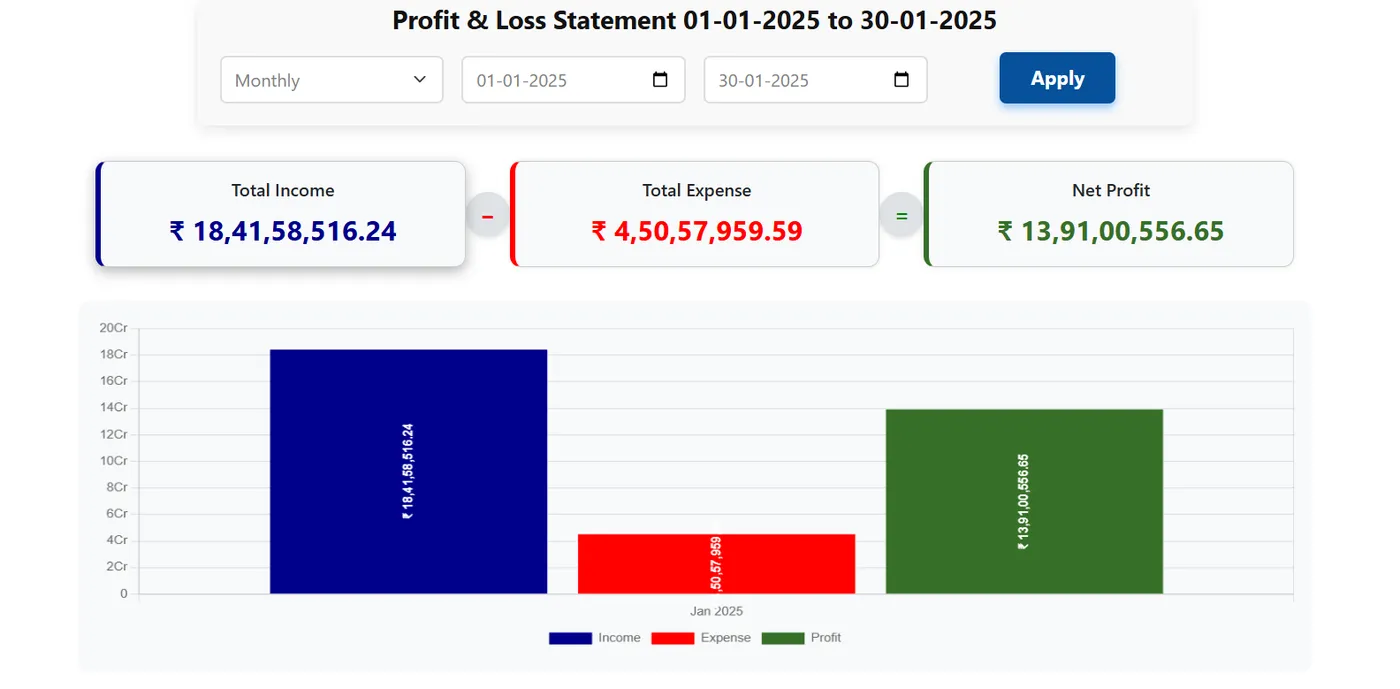
Know your profit every day: revenue, COGS, gross and net profit, OPEX, cash received, receivables ageing and the top SKUs, filtered by date, entity, channel and product.
On this page
OverviewThe dashboard at a glance
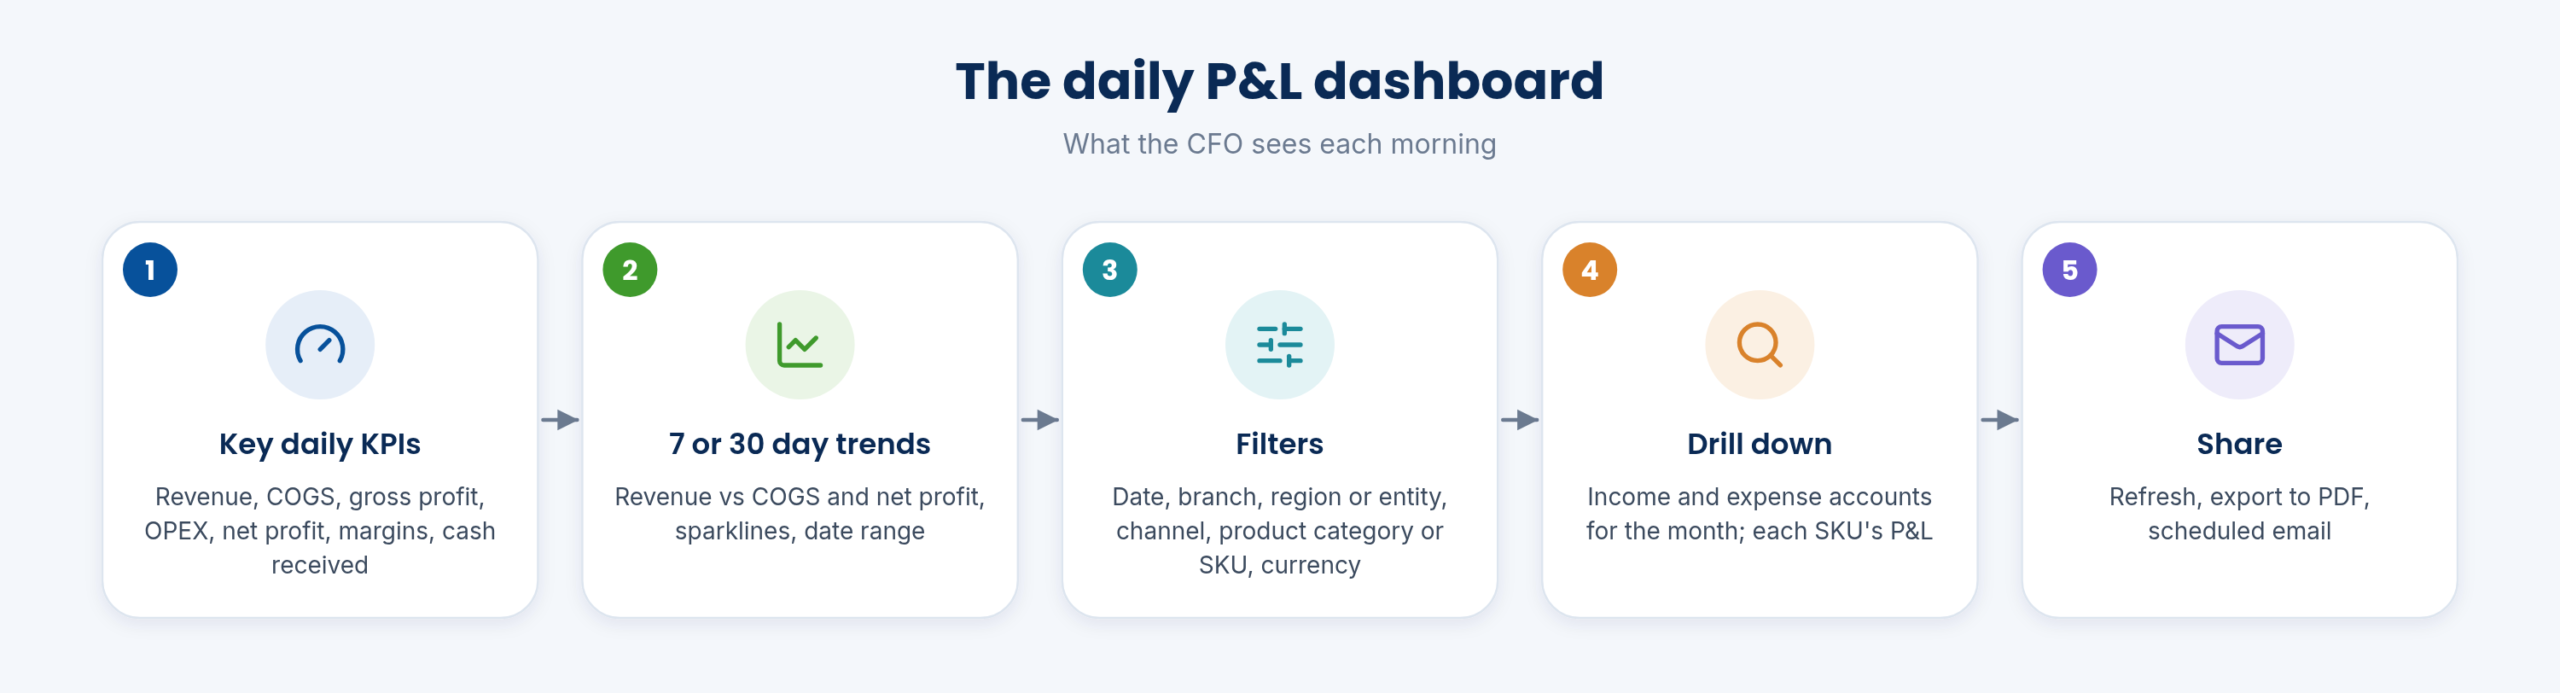
The daily P&L dashboard is built from every module’s transactions: procurement, sales, stores, payroll and expenses post into the chart of accounts, and the dashboard reads them back as the day’s KPIs.
The diagram shows its five parts: KPIs, trends, filters, drill-downs and sharing.
DashboardKey daily KPIs
The dashboard opens on the day’s total revenue, COGS, gross profit, OPEX, net profit or loss, gross margin, net margin and cash received.
It is the first page the CFO and MD read each morning.
- Key daily KPIs: Total revenue, COGS, gross profit, OPEX, net profit / loss, gross margin %, net margin %, cash received
DashboardTrend charts and filters
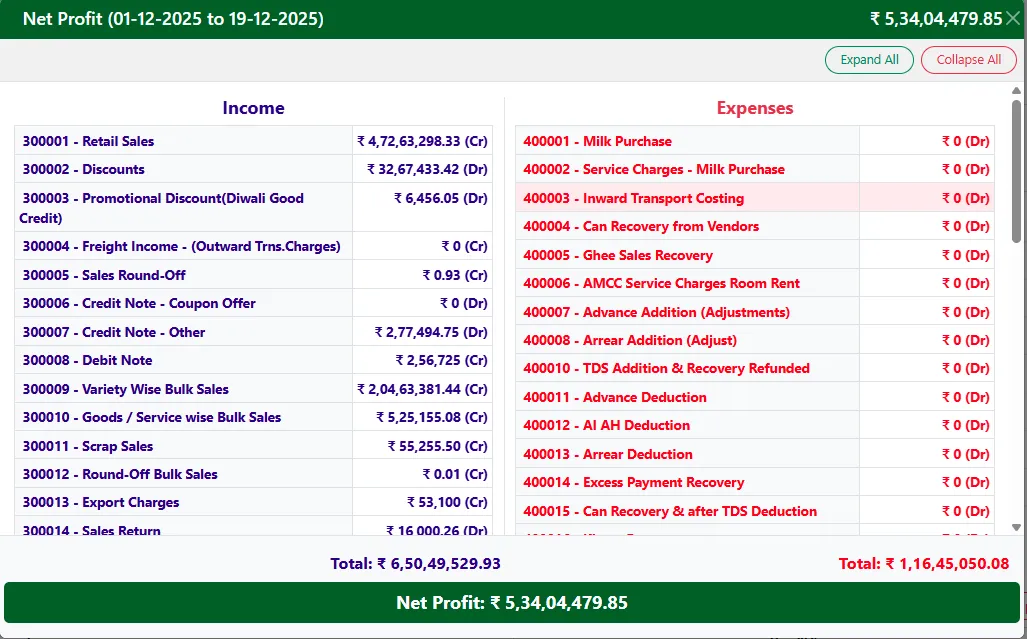
Revenue against COGS and net profit is charted for 7 or 30 days, with sparklines and a date range selector. Filters cover date, branch, region or company entity, channel, product category or SKU and currency; refresh, export to PDF and scheduled email are one click.
A plant or a channel is examined on its own without a separate report.
- Daily P&L dashboard: Revenue vs COGS vs net profit (7 / 30 days); sparklines; date range selector
- P&L filters and actions: Date; branch / region / company entity; channel; product category / SKU; currency; refresh, export PDF, schedule email
DetailsIncome and expense drill-downs
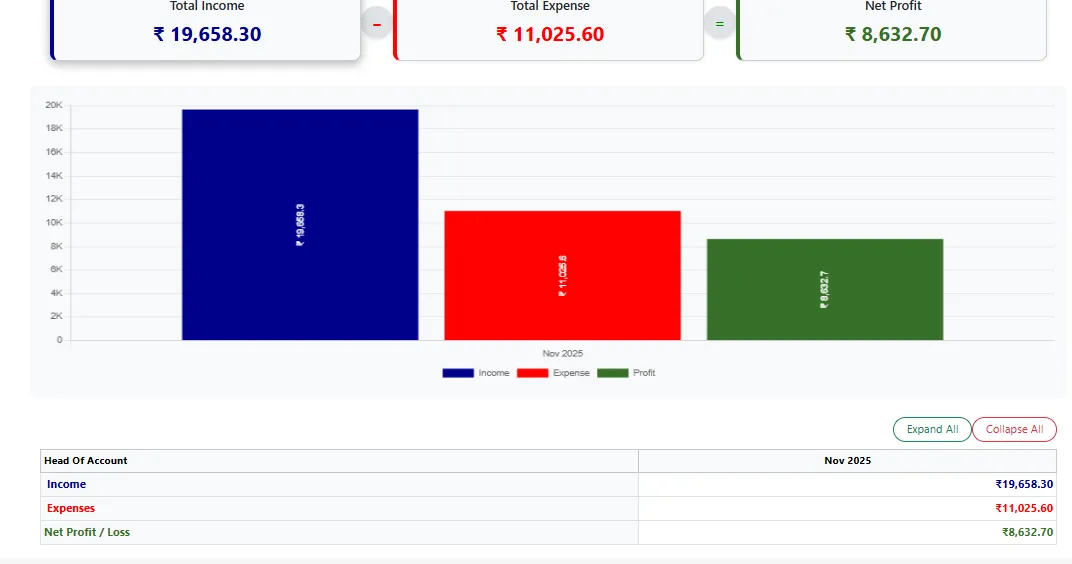
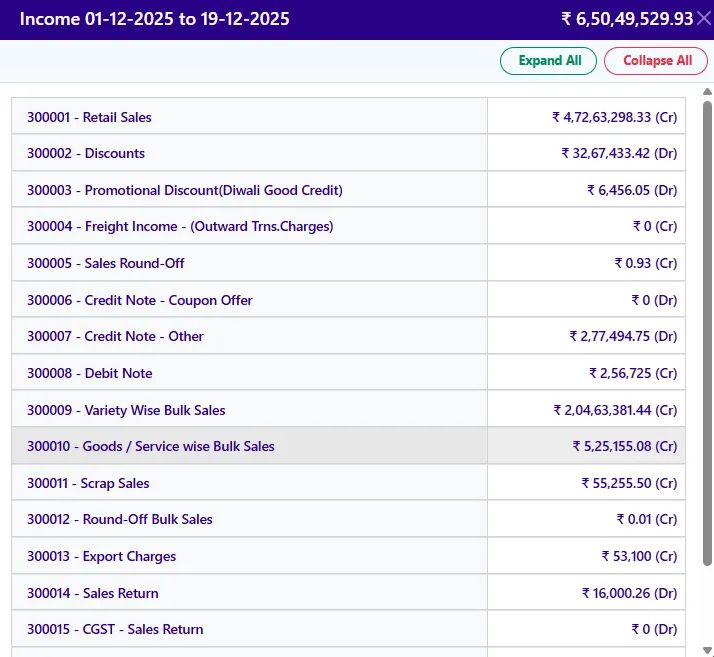
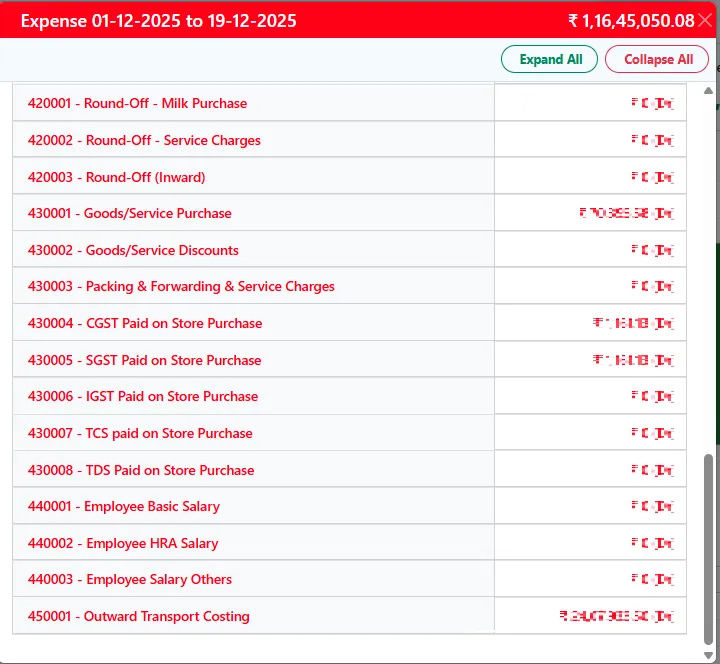
The P&L details list the income and expense accounts for the month, and each can be drilled into.
Any unusual line is traced to its transactions.
- P&L details: income and expense accounts for the month
FAQFrequently asked questions
Can I filter by plant?
Yes, by branch, region or company entity.
Can it be mailed?
Yes, on a schedule.
Keep exploring at your own pace
Every module page walks through the screens, reports and mobile apps in the same way, so you can see exactly how EasyDairyERP fits your dairy.
When you have seen enough, we are happy to show it to you live on our sample data: book a demo or call +91 94880 59495.