
BI Report on Sales
Sales BI shows how every dock, route, team, customer type, product, variant and variety is trending, with trend-change reports and mails that land in your inbox.
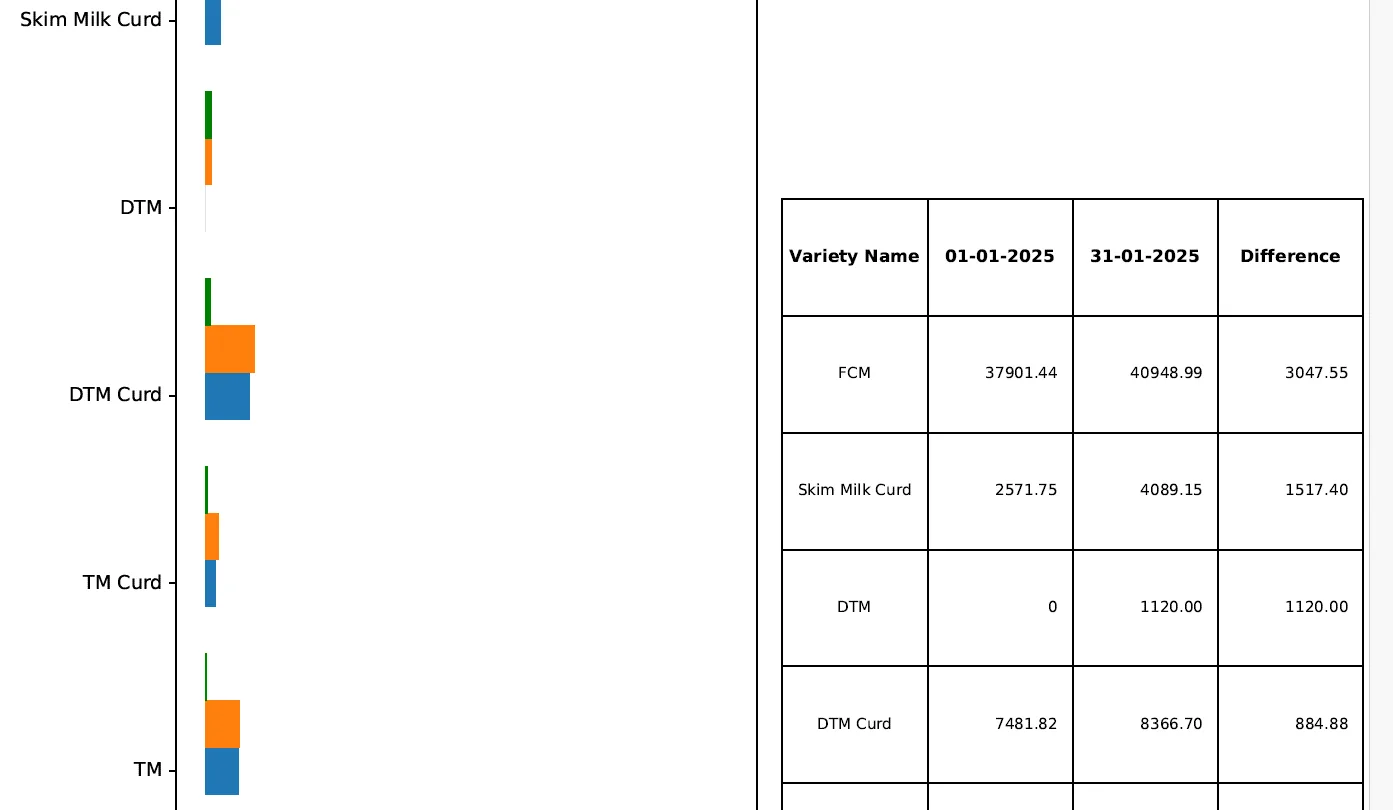
BI Report on Sales shows how every dock, route, team, customer type, product, variant and variety is trending, and mails the result to the people who act on it. The reports and screens are explained below with real screens (company, route and customer names blurred).
On this page
How it worksFrom the day’s sales to the morning’s decisions
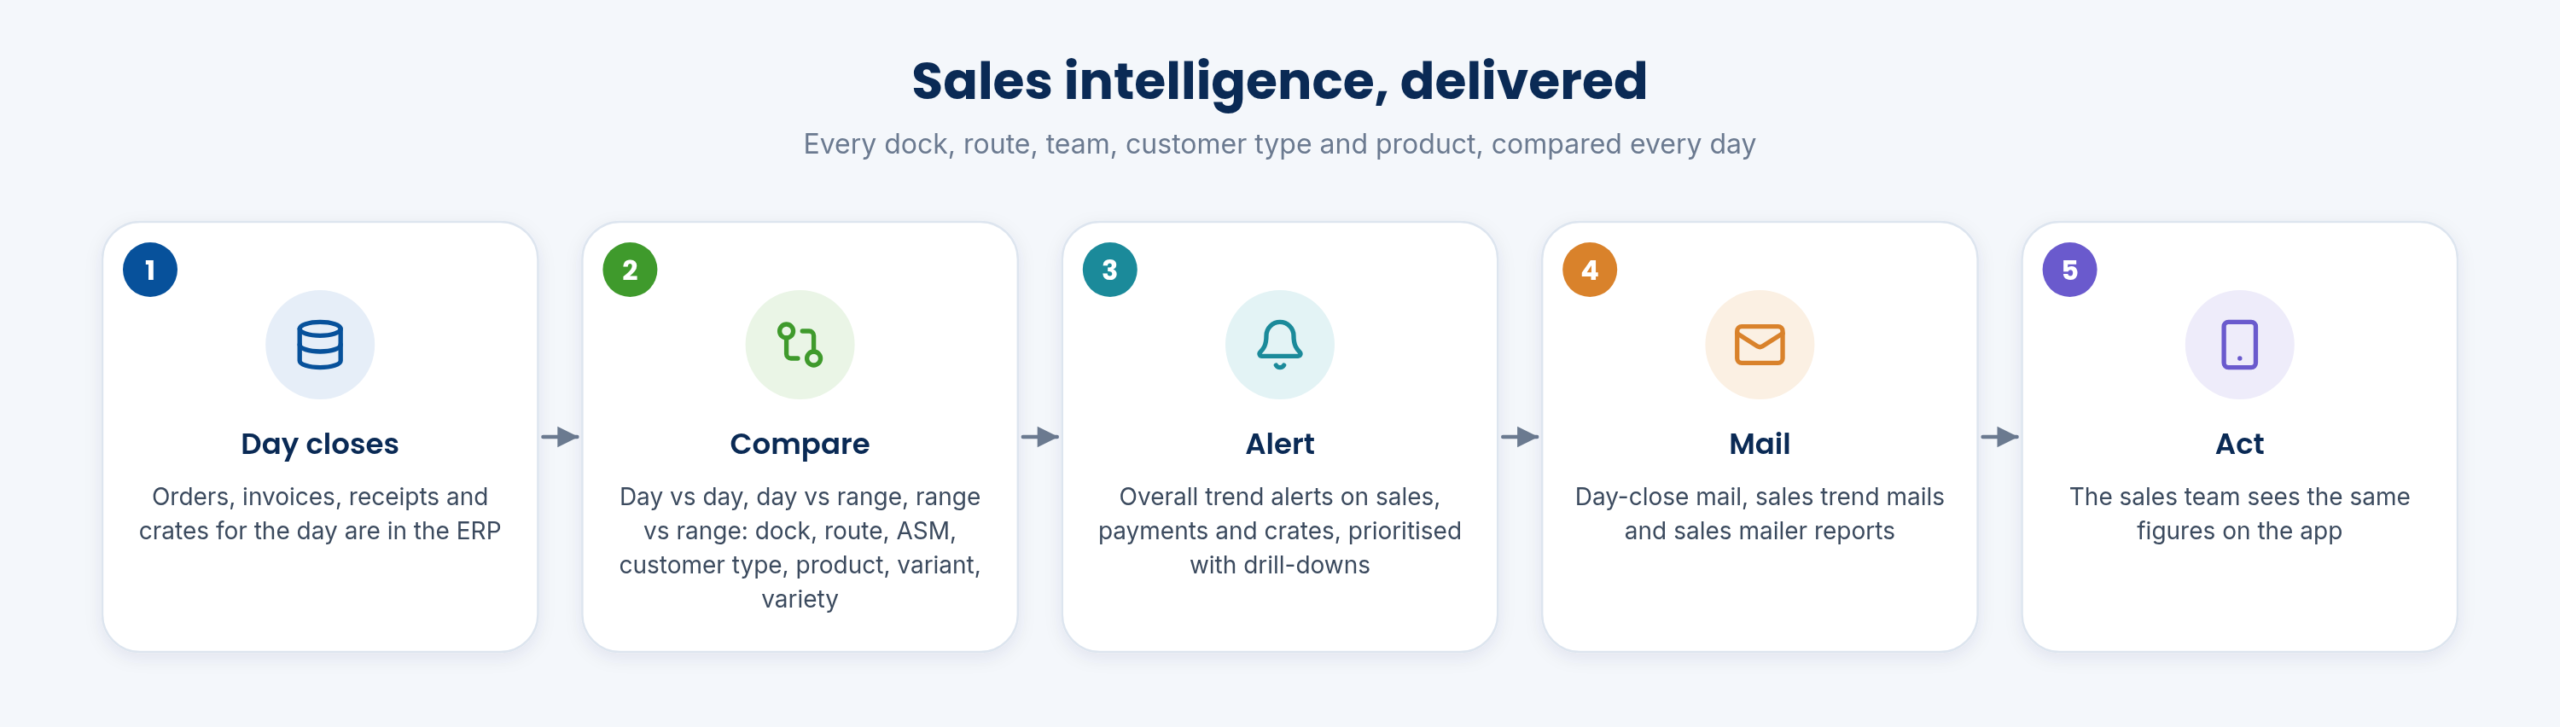
When the day closes, orders, invoices, receipts and crates are in the ERP. The BI layer compares the day against another day or range, raises alerts on sales, payments and crates, and mails the day-close and trend reports.
The sales team sees the same figures on the app, so the discussion starts from one set of numbers.
- Day closure report email basic and advanced (customer monitor); Day Closing Report; Day Close Mail Automation
- Overall trend alerts (sales / payments / crates) with prioritising and drill-downs
- Sales trend mail automation; Trend Change Report
ReportsSales Trend Change Report
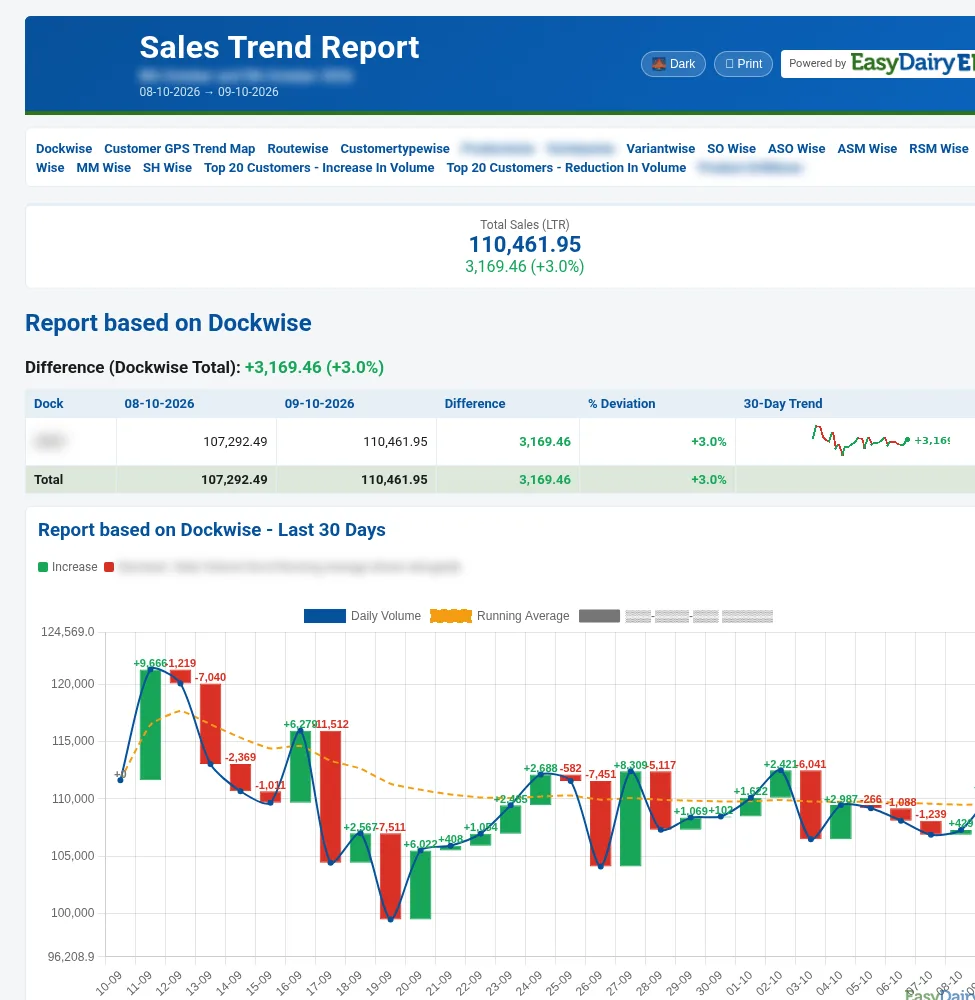
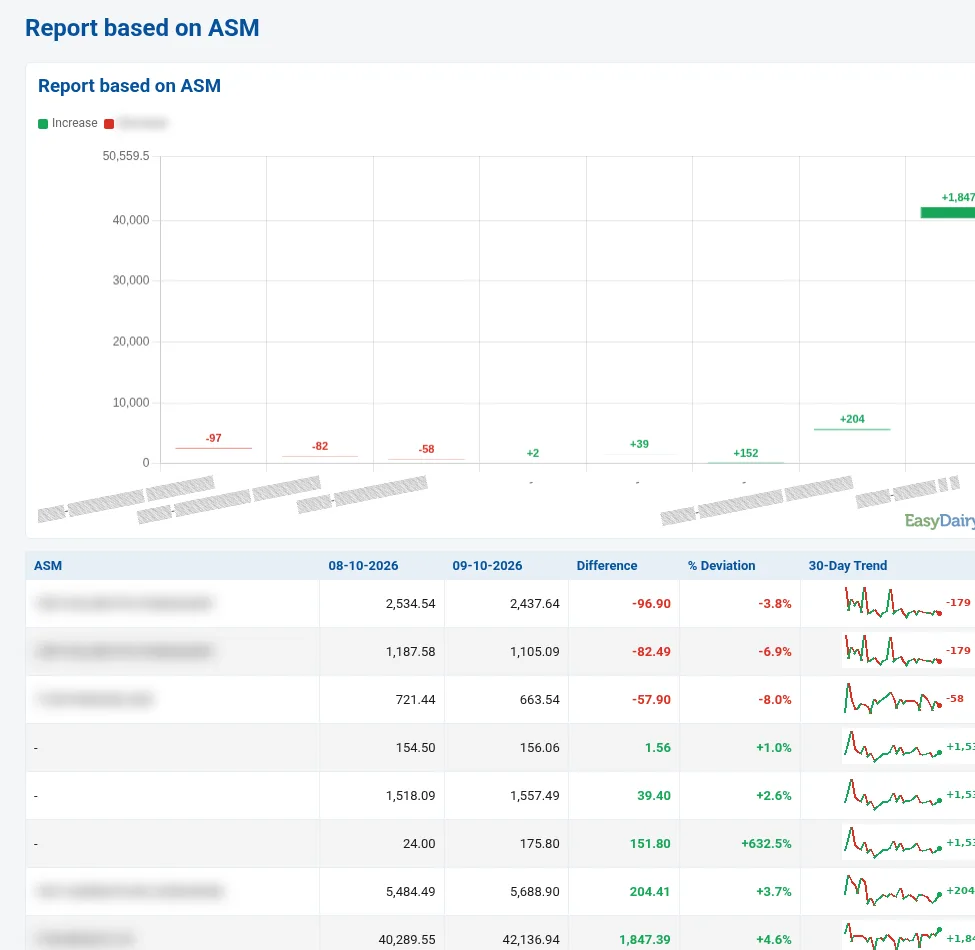
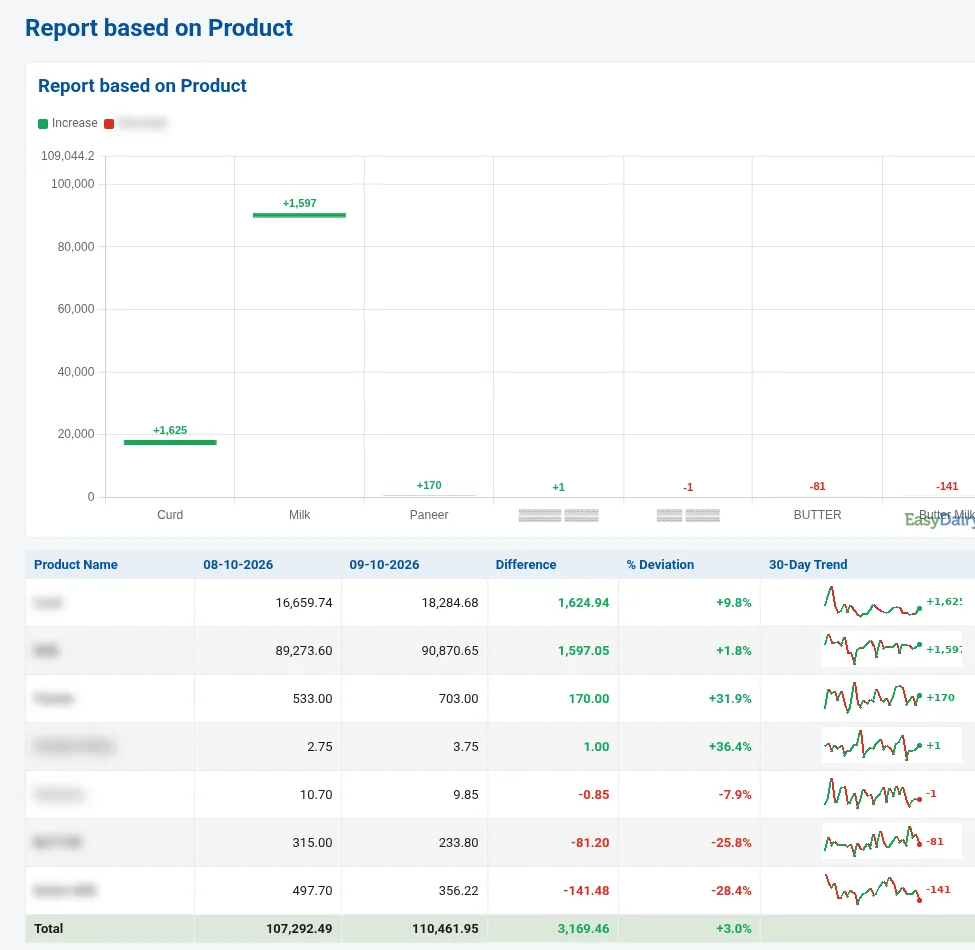
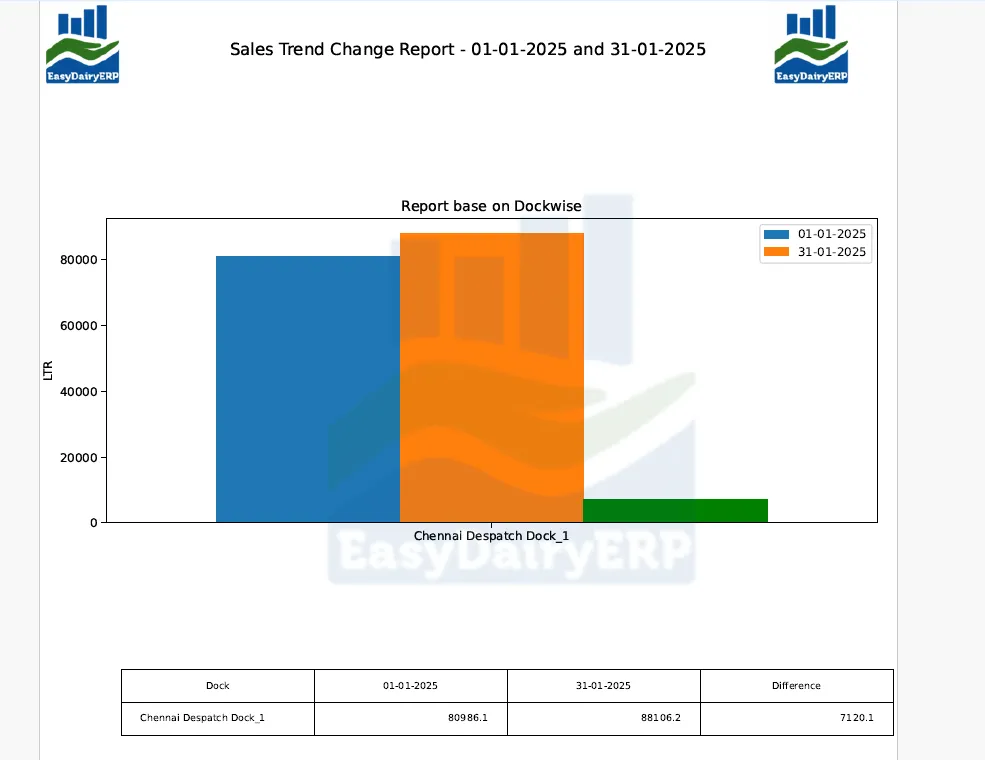
The Sales Trend Change Report compares any two days of sales and drills from the dock down to the route, customer type, product, variety, variant and each level of the sales team, with a 30-day trend on every line. It is sent daily by email and is on the web.
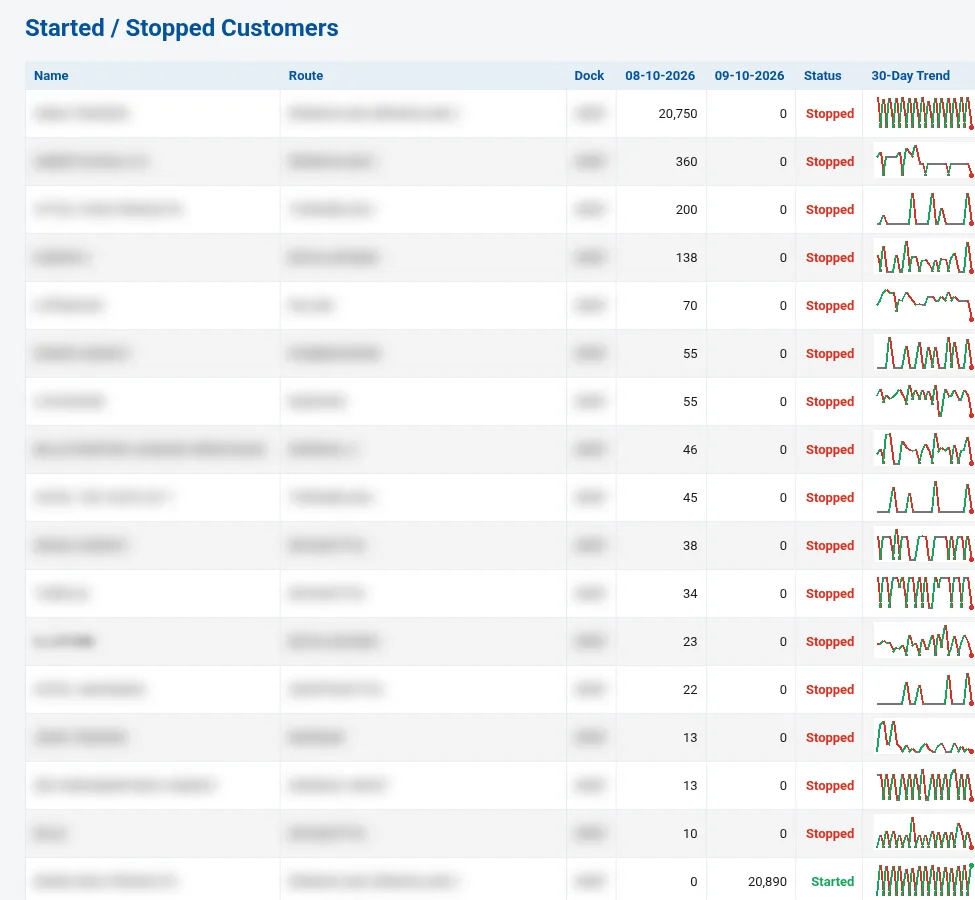
It includes the total for the day against the comparison day, the dock-wise comparison and 30-day chart, the last 10 days, and started and stopped customers with their route and dock, so lost and new customers are visible the next day.
- Sales Trend Change Report (PDF): Dock-wise, route-wise, ASM, customer type-wise, product, variant, variety
- Trend reports sales-wise and route / ASO-wise
ReportsDaily Sales and Activity Report
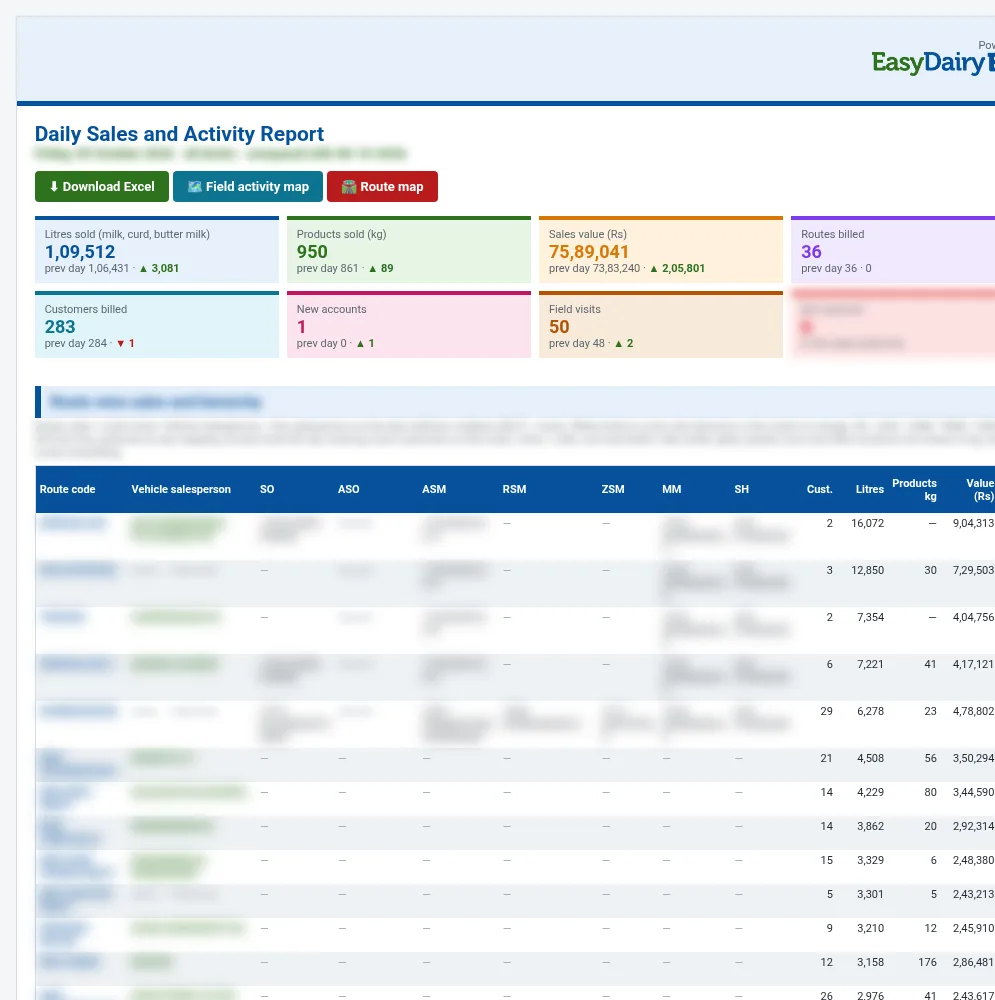
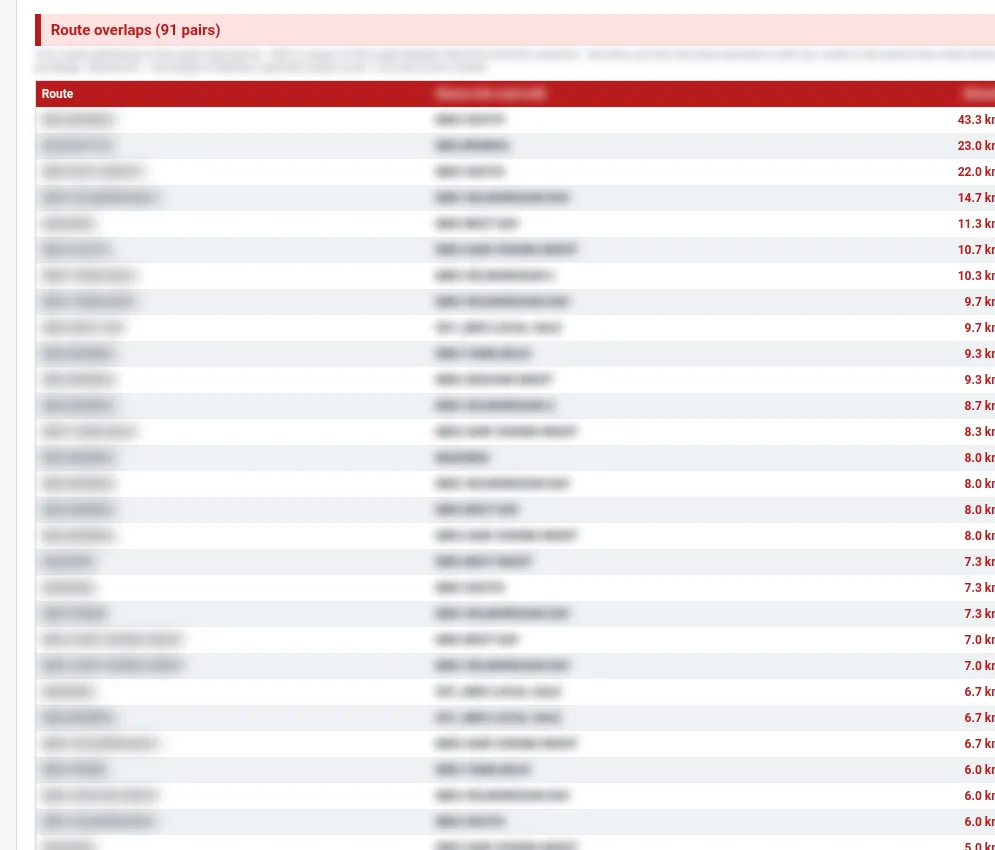
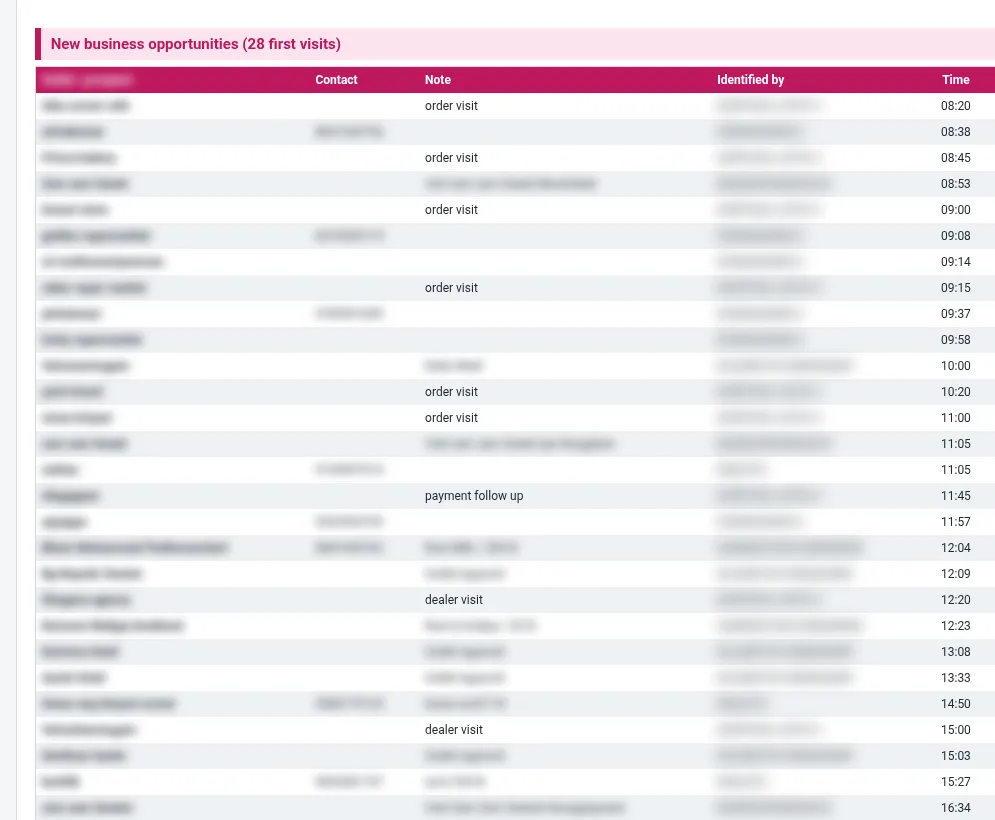
The Daily Sales and Activity Report puts the sales day and the field force together: what was sold and what the field staff did, with the activity map, route overlaps and new opportunities.
It is used to see where sales staff spent their time, which routes overlap and where new customers could be served.
- Sales volume trend for route / field force (maps)
ReportsMarket Cost Report
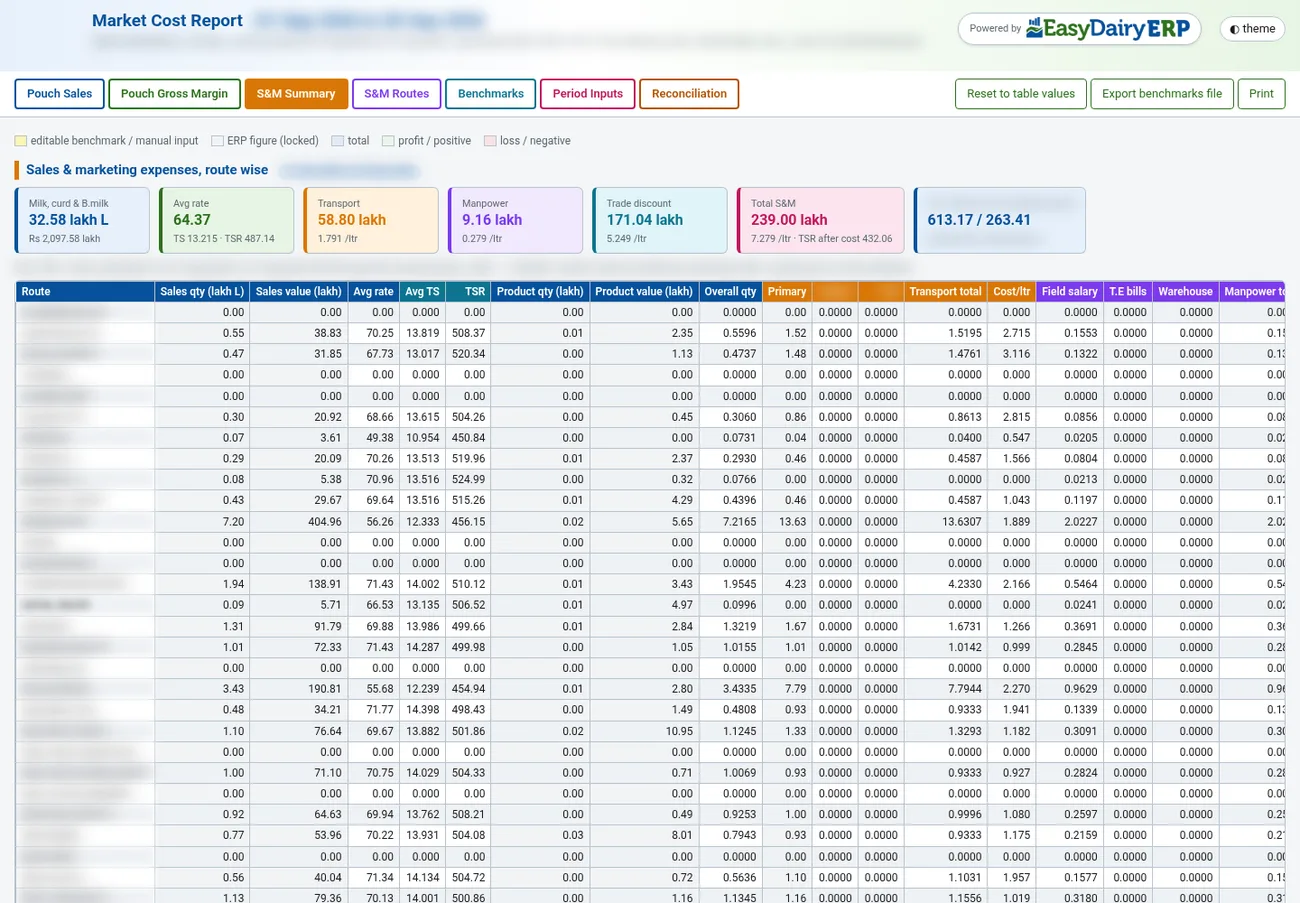
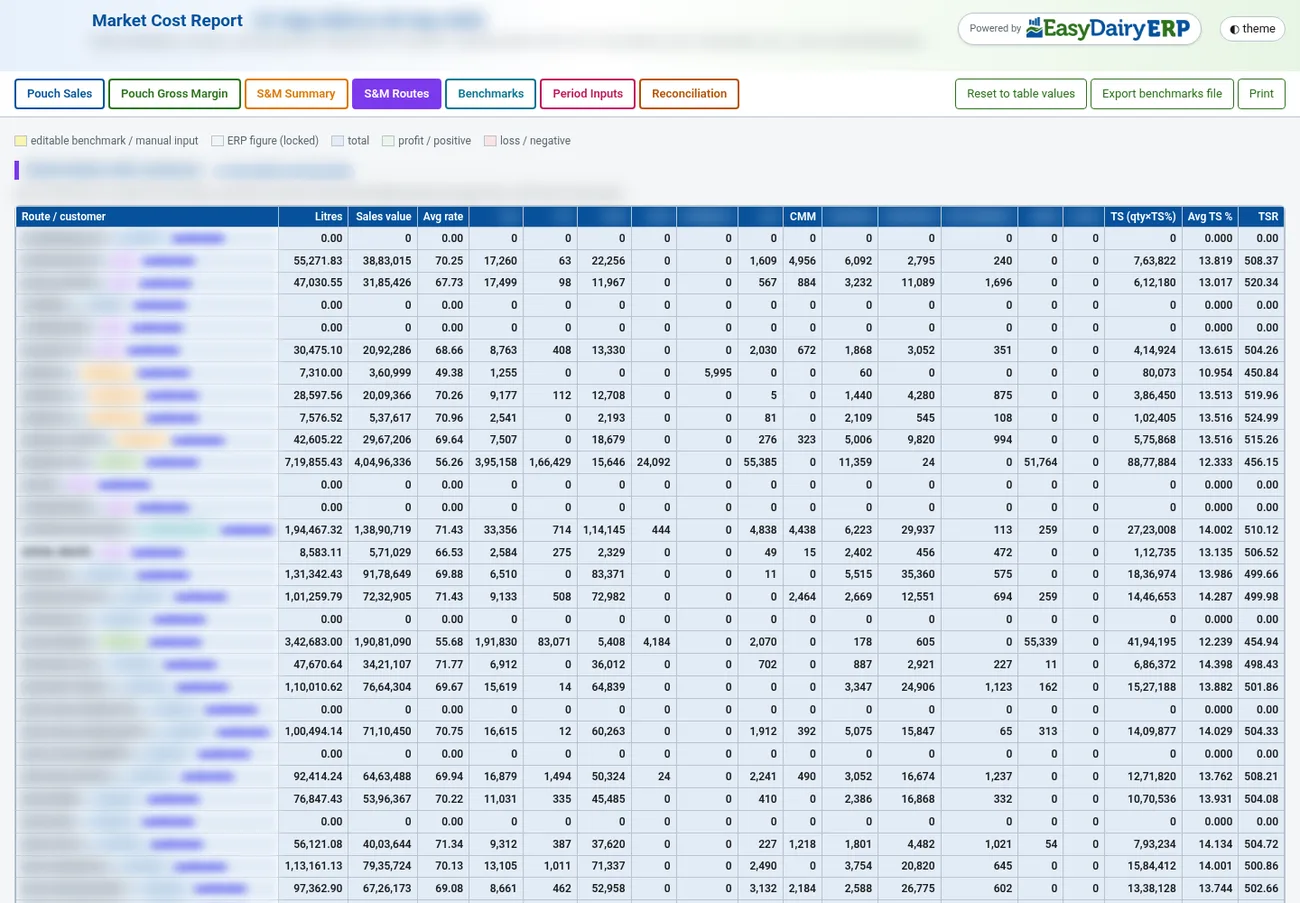
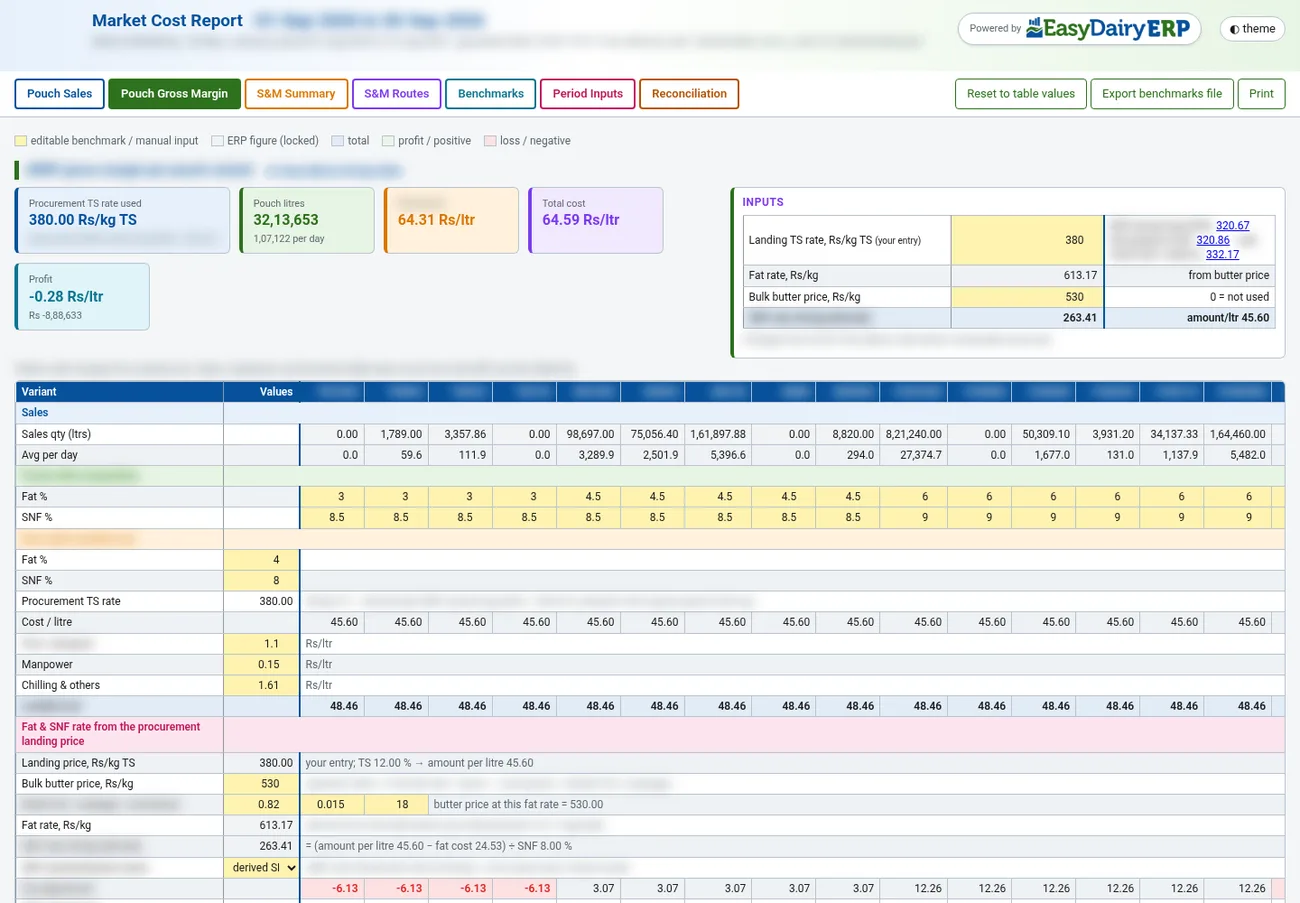
The Market Cost Report shows what it costs to serve the market: sales and marketing cost by route, the summary and trend, and pouch sales against pouch gross margin.
It lets management see which routes and products carry their cost, and which do not.
- Product performance
MailersSales mailers and volume trends
Sales mailer reports 1 to 3 bring the sales business analytics to the inbox: the summary, the trend with crates and the variants. Date-based and month-based sales volume trends, and the S&M team monthly and daily volume trend, track the team.
Because they arrive by mail, managers who are not logged in still see the day.
- Sales mailer reports 1-3; sales business analytics report on mail
- Date-based and month-based sales volume trend; S&M team monthly & daily volume trend
- Real-time market trend analytics
ScreensThe sales BI dashboard and sales screens
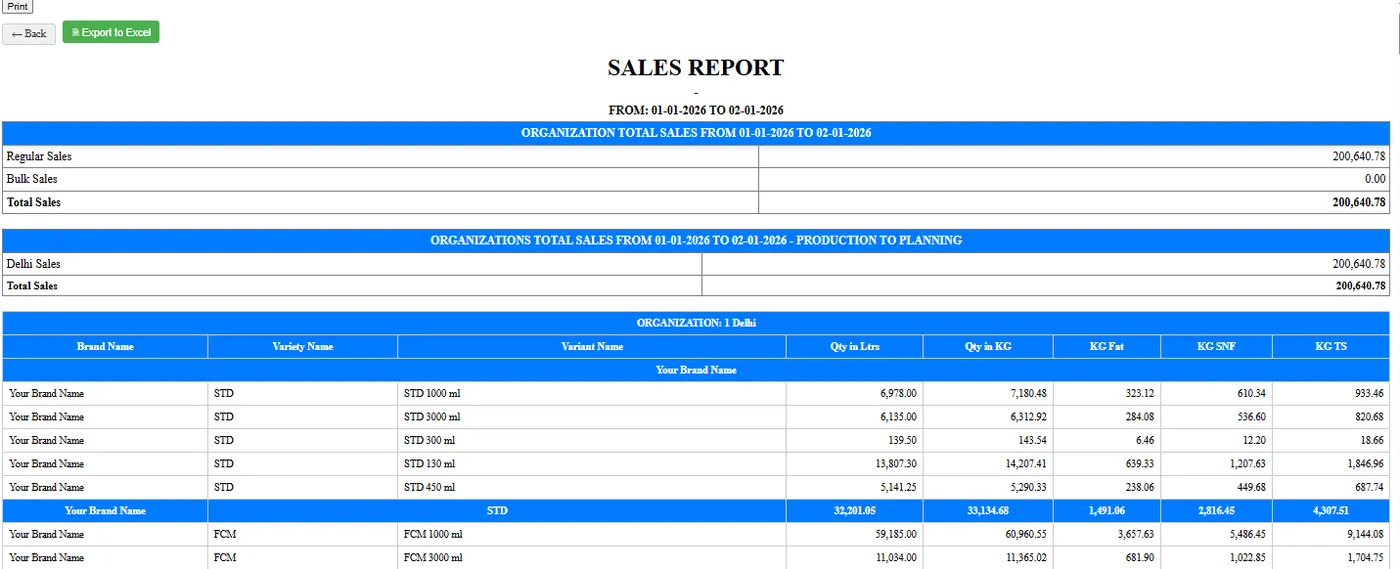
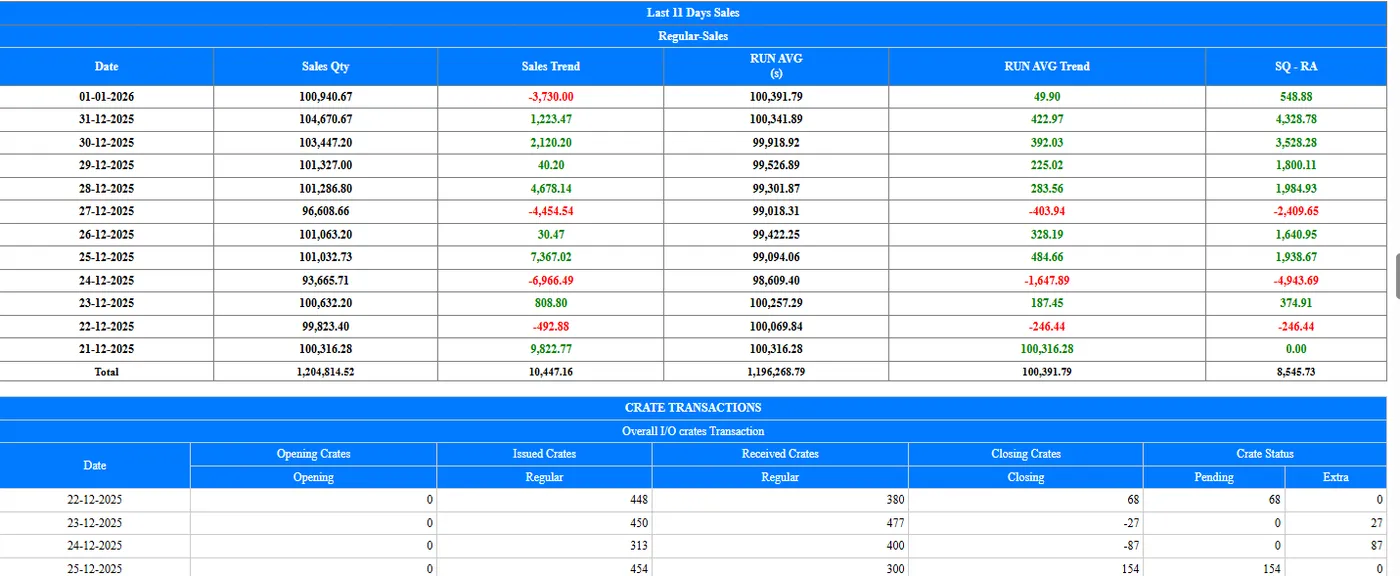
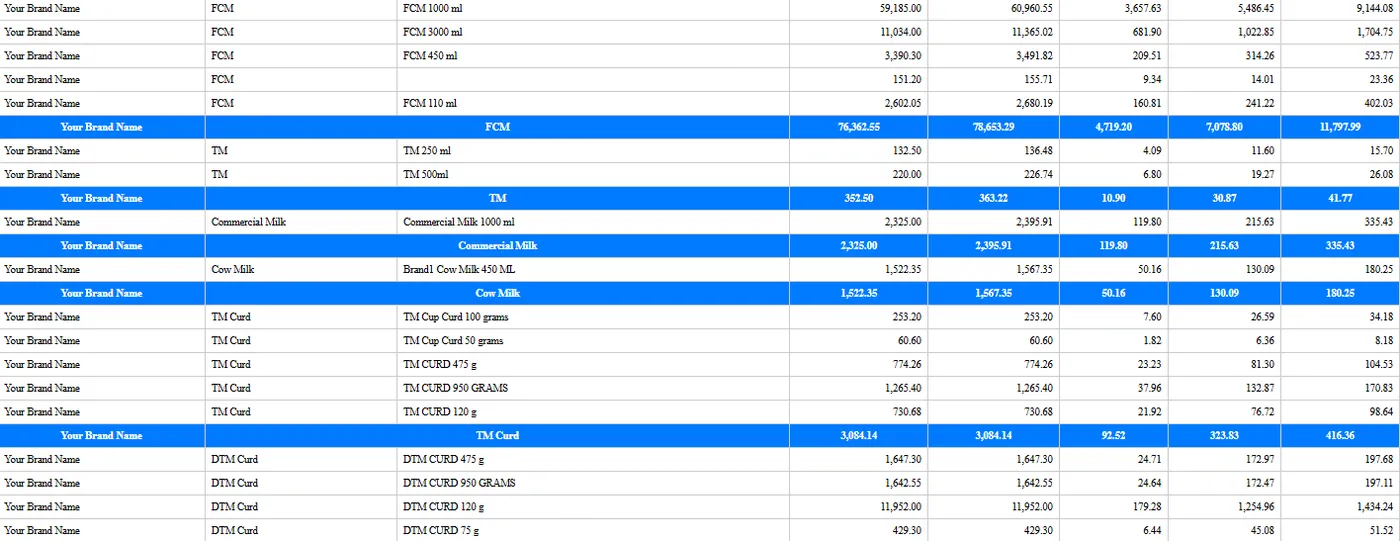
The sales BI dashboard, the live dashboard and the 7-day trend give the overview. The sales screens cover the comparison route-wise and customer-wise, customer amount transactions including the last 30 days, the variant-wise trend, GSTR-1 HSN-wise and customer-wise, incentive and discount statements, customer ledgers, overall credit flow and pouch costing.
Each is shown and explained on Sales Screens. Ledger, transaction summary and realisation reports complete the set.
- Sales BI dashboard
- General sales screens and reports
- Sales Live Dashboard; Sales 7 Days Trend Dashboard
- Sales Comparison Report route-wise and customer-wise
- Customer Amount Transaction Report (incl. last 30 days)
- Variant-wise Sales Trend
- GSTR-1 Report HSN-wise and customer-wise
- Incentive or Discount Statement; Incentive Type-wise Report
- Customer Ledger; Customer Transaction Report
- Overall Credit Flow
- Pouch Costing Report
- Ledger and transaction summary reports; several sales reports; advanced sales analysis
- Realisation reports date-wise; advanced route-wise realisation
SpecificationsAt a glance
| Trend Change Report | Daily; dock, route, ASM, customer type, product, variant, variety |
|---|---|
| Daily Sales and Activity Report | Sales and field activity, maps, overlaps, opportunities |
| Market Cost Report | Cost by route, trend, pouch sales and gross margin |
| Mailers | Day close, trend, sales mailers 1-3, alerts on sales, payments and crates |
FAQFrequently asked questions
Can I compare any two days?
Yes, by dock, route, team, customer type, product, variant and variety.
Do I need to log in?
No; the mailers arrive by email.
Are lost customers shown?
Yes: started and stopped customers with route and dock.
Sales Trend Change Report
Compares any two days of sales and drills from the dock down to the route, customer type, product, variety, variant and each level of the sales team, with a 30-day trend on every line.
- Which customers stopped buying yesterday and need a call today
- Which products and variants are losing volume, and on which routes
- Which members of the sales team need support
Keep exploring at your own pace
Every module page walks through the screens, reports and mobile apps in the same way, so you can see exactly how EasyDairyERP fits your dairy.
When you have seen enough, we are happy to show it to you live on our sample data: book a demo or call +91 94880 59495.