
Daily Profit & Loss (P/L) Dashboard
Real-time daily profit and loss view with revenue, costs, margins and cash movement — updated daily
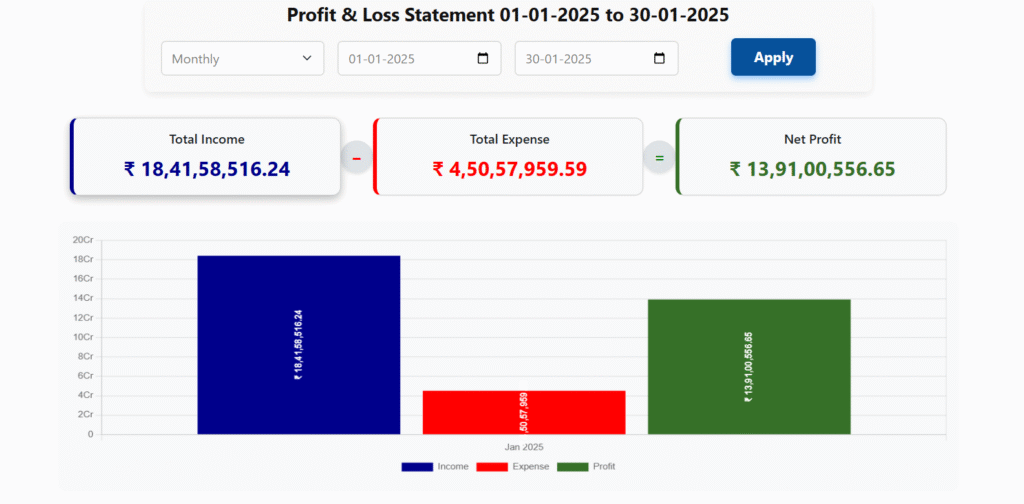
Line chart: Revenue vs COGS vs Net Profit (7-day and 30-day toggle)
Sparkline cards for quick trend: Revenue ↑ / COGS ↑ / Net Profit ↓
Small selector: Date range (Today, Last 7 days, Last 30 days, last 3 months,last 6 months,Custom)
Microcopy: “Select a date range to compare daily movements.”

Total Revenue (Today)
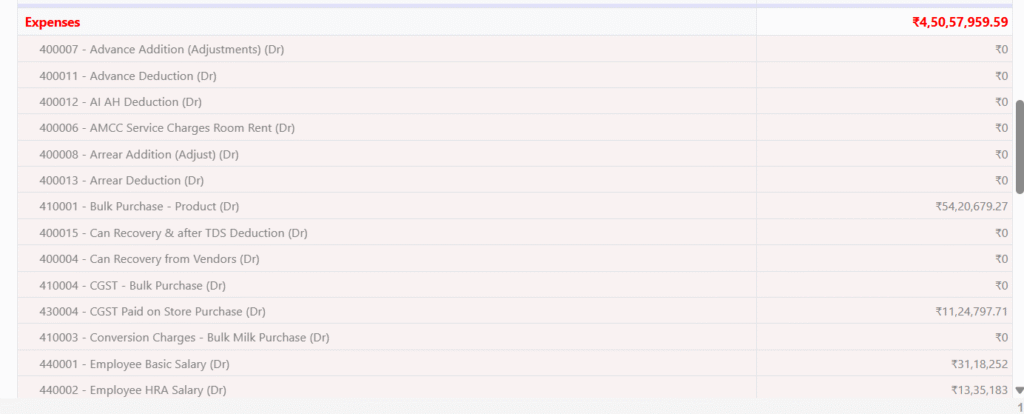
Total COGS (Today)
Gross Profit
Operating Expenses
Net Profit / (Loss)
Gross Margin %
Net Margin %
Cash Received (Today)
Date (Today / Custom) — default Today
Branch / Region / Company Entity
Channel (All / Retail / Online / Distributor)
Product Category / SKU
Currency (if multi-currency)
Quick actions: Refresh Data | Export PDF | Schedule Email Report